[Page 8]

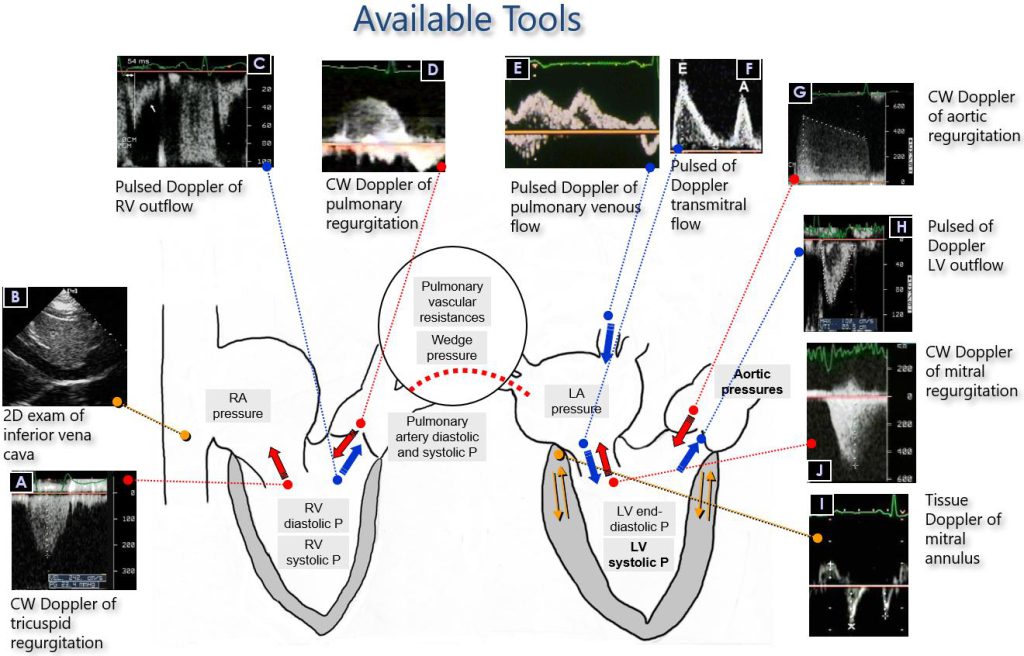
Figure 8. The Doppler ultrasound “tool map” useful for performing a complete non-invasive hemodynamic examination for the analysis of left ventricular diastolic function.
The different cardiac intracavitary pressures are shown within the central diagram of the heart chambers, from left to right: average right atrial, systolic and diastolic right ventricular and pulmonary artery, pulmonary capillary wedge pressure, average left atrial pressure, and LV systolic and diastolic pressures. Thick blue arrows: pulsed Doppler sampling of antegrade flow. Thick red arrows: continuous wave Doppler sampling of retrograde flows (regurgitations). More in detail, with pulsed Doppler we measure the right upper pulmonary vein and transmitral low flow velocities. With continuous Doppler we measure the high flow velocities a) in systole between the left ventricle and the left atrium when mitral regurgitation is detectable; b) in diastole between pulmonary artery and right ventricle when pulmonary regurgitation is detectable; c) in systole between the right ventricle and right atrium when tricuspid regurgitation is detectable. Orange dotted line on the right: pulsed tissue Doppler sampling of the mitral annulus, which analyses the systolic-diastolic function of the myocardial longitudinal fibers; the early diastolic peak e’ velocity bears a direct relation to ventricular relaxation and thus plays an important role in the non-invasive estimation of ventricular relaxation and filling pressures. Green dotted line on the left: 2D assessment of the inspiratory collapsibility of the inferior vena cava, used to estimate the mean right atrial pressure; in the absence of tricuspid stenosis, this is comparable to the right ventricular end-diastolic pressure.
CW: continuous wave; LV: left ventricular; RV: right ventricular; P: pressure; PA: pulmonary artery.
ESTIMATION OF THE DETERMINANTS OF DIASTOLIC FUNCTION
Figure 8 shows all the tools that can be used with Doppler echocardiography to perform a complete non-invasive hemodynamic examination and to analyze the LV DF. Both pulsed wave and continuous wave Doppler methods are used to measure instantaneous blood flow velocities, which are an expression of pressure differences between the blood pool which is upstream and that which is downstream relative to the sampling position. The difference between the two methods is that with pulsed Doppler we sample a chosen point (with the disadvantage of not being able to measure blood flow velocities higher than approximately 2 m/s), while with continuous-wave Doppler we sample the highest velocity along a certain sampling scan line without the knowledge of the exact location (although color Doppler can be of help). By measuring a pressure difference, we can arithmetically derive the value of the required absolute pressure from the other.
It is also important to bear in mind that:
1) we measure blood flow velocity – not a flow volume (which depends on the section area of the sampling point);
2) the measured velocities reflect a local pressure difference (not absolute pressure values);
3) many independent factors influence this non-invasive estimation: LV relaxation; LV passive elastic properties; LV pre- and afterload; LV systolic function; LA function (LA mean pressure; LA relaxation; LA chamber stiffness; LA systolic function); pericardial properties; the ventricular inter-dependence phenomenon; age; heart rate;
4) different technical factors influence the flow velocity profiles (ex: position of the sample volume);
5) all sampling must be performed at the end of a quiet expiration.