[Page 11]
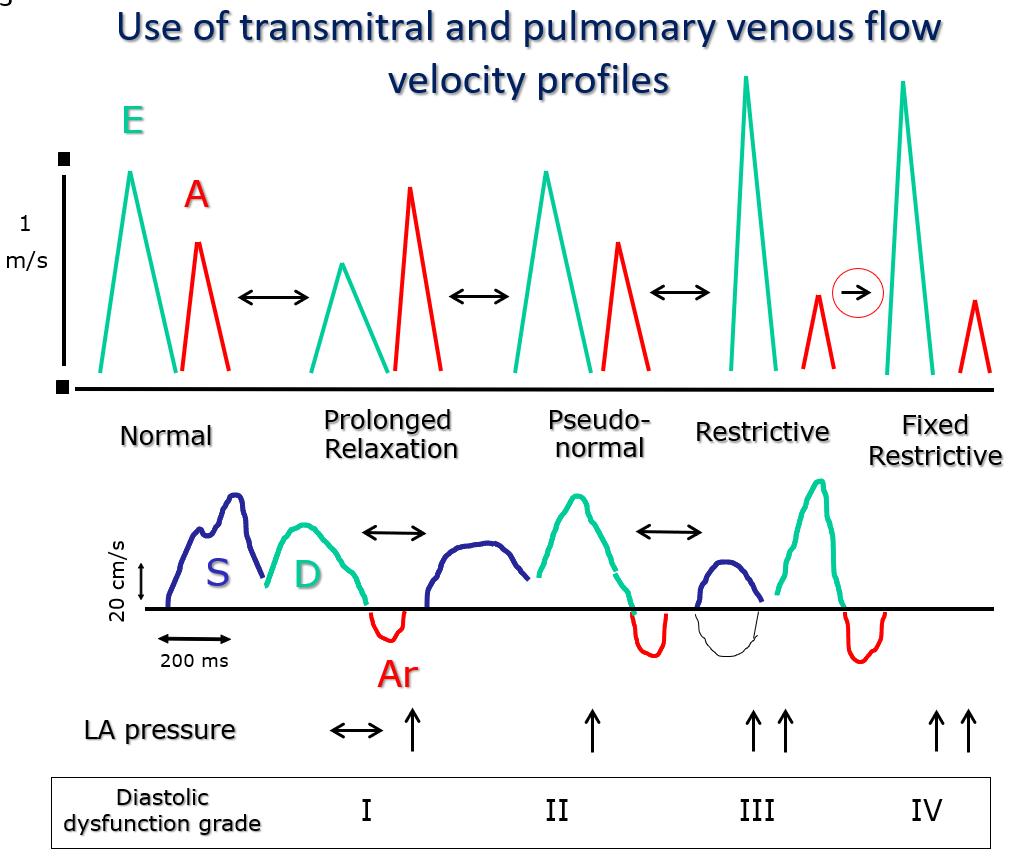
Figure 3. The classes of diastolic dysfunction (I to IV) correspond to specific transmitral flow velocity profiles known as “prolonged relaxation”, “pseudo-normal”, “restrictive” and “fixed restrictive”. Class I is characterized by an isolated prolongation of myocardial relaxation. Class II combines an initial reduction in chamber compliance (=increase in stiffness) associated with underlying prolonged relaxation. In class III the reduction of chamber compliance is prevalent over the prolongation of relaxation). Between class I and III there is a progressive increase in filling pressures, which are highest in classes III and IV. Unlike in class III, in class IV the preload reduction maneuvers (nitrate infusion, Valsalva maneuver) are unable to reduce filling pressures. The main advantage of adding pulmonary venous flow profile analysis to mitral valve flow is that it is easier to distinguish the “pseudo-normal” mitral flow profile from normal, because the pulmonary venous profile is “systolic dominant” (prevalence of the systolic wave S) only in normal older subjects and in patients with a prolonged relaxation. In patients with a “pseudo-normal” mitral profile, the pulmonary venous flow profile will show “diastolic dominance” (prevalent diastolic forward D wave). Of note, the peak E wave and deceleration time values of Normal and “Pseudo-normal” profiles are similar.
LA: left atrial.
The diagram in Figure 3 summarizes the concepts discussed so far, seamlessly relating the different transmitral flow profiles: normal, impaired relaxation, pseudo-normal and restrictive. Three important concepts are expressed:
1) Any of the different DD flow velocity profiles corresponds to an impairment of one or both of the main determinants of LV DF (relaxation and chamber compliance).
2) There is a reproducible progression of the alterations of LV DF, which is common to most heart diseases. With the progression of the disease, the flow pattern shifts from normal to prolonged relaxation, and then to pseudo-normal and finally restrictive (the latter two determined by a superimposition of increased LV stiffness on greatly prolonged relaxation).
3) The flow velocity profiles are very sensitive to changes in loading conditions, in particular to LA pressure. Most of all, each profile corresponds to a certain degree of increase in LA pressure: normal or initially increased in the “prolonged relaxation” profile, moderately high in the “pseudo-normal “, and very high in the “restrictive” profile. By changing the LV loading conditions, it is possible to observe the transition from one flow profile to another. For example, a reduction in LA pressure will modify the “pseudo-normal” profile into a “prolonged relaxation” one, with a progression that is opposite to that occurring in the opposite direction with the natural progression of the disease (where increasing LA pressure modifies the profile from “prolonged relaxation” to “pseudo-normal”). Further, the “fixed restrictive” profile is so-called because it is not modifiable by load changes, and it reflects an extreme degree of DD. Finally, each flow velocity profile corresponds to a specific degree of DD, which facilitates classification and diagnosis (Figures 3 and 4). As the DD class progresses, the prognosis worsens, regardless of LV systolic function.
Isovolumic Relaxation Time (IVRT). It is obtained by sampling simultaneously LV inflow and outflow in the apical 5-chamber view, by positioning the sample volume (width > 5 mm) “straddling” the 2 color Doppler signals (Figure 10, white circle), recording the end of the outflow profile (Figure 11, LVOT)followed by the beginning of the transmitral inflow profile (E wave). The distance (ms) between the outer edge of the two signals is measured (Figure 11, red dotted lines). The IVRT duration is directly dependent on LV relaxation velocity (τ), and on LA and LV pressures. The IVRT is prolonged by a prolongation of LV relaxation or a reduction of LA pressure, whereas it is shortened by an increase in LA pressure. –
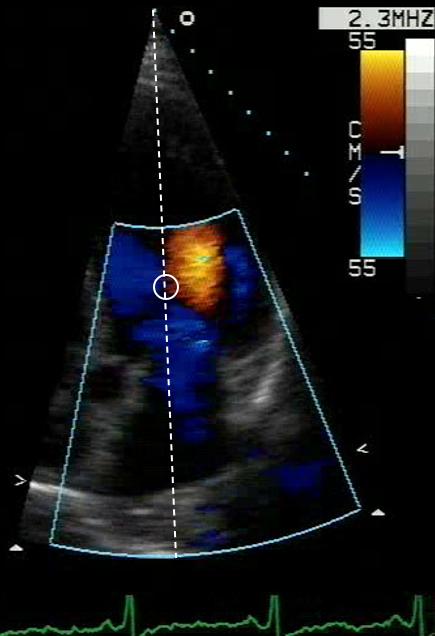
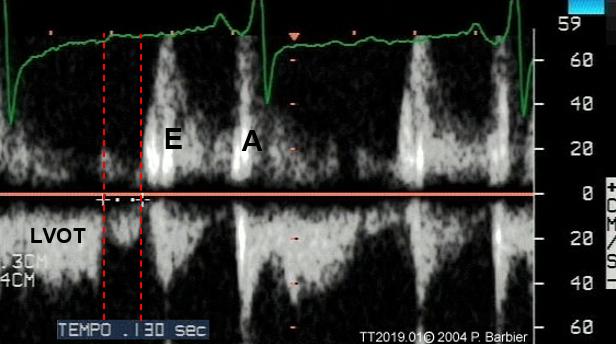
Figure 10 and 11. Measurement of isovolumic relaxation time.
LVOT: left ventricular outflow tract.
Pulmonary venous flow profile. The pulmonary venous flow profile is obtained by sampling the ostium of the right upper pulmonary vein. Since the velocities measured reflect the local pressure difference between the vein and the LA cavity, the usefulness of the method relies on the possibility to both estimate the modalities of LA filling and emptying, and to estimate the trend in time of LA pressure changes (i.e. of one of the LV filling pressures).
Sampling methodology. The sample volume (width > 5 mm) must be positioned straddling the right superior pulmonary vein ostium (near the interatrial septum) and the LA cavity in the apical 4-chamber view, under color Doppler guidance. It is convenient to increase the color Doppler gain to better visualize the pulmonary venous flow, especially if the ostium of the vein is not clearly visualized with the 2D exam. Positioning the sample volume too distal in the LA cavity will produce artifacts in the venous flow profile, with underestimation of the flow velocities.
Measurements. The pulmonary venous flow velocity profile (Figure 12) shows 2 antegrade systolic waves, the second greater than the first (14), and 2 diastolic waves the first early diastolic and anterograde (flow towards the LA), and the second end-diastolic and retrograde (flow into the vein). Measurements should include (abnormal cutoff values are shown in Table 3):
1) the velocity-time integral of the total systolic wave (Si);
2) the velocity-time integral of the antegrade diastolic wave (Di);
3) the Si/Di ratio;
4) the duration of the retrograde end-diastolic wave (Ardur).