[Page 14]
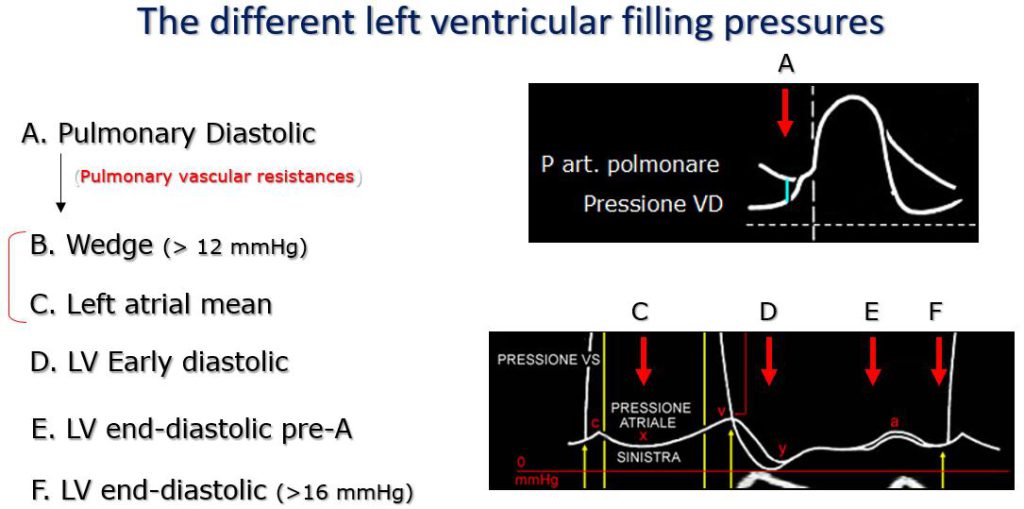
Figure 14. Beginning upstream to the right cardiac chambers we have the pulmonary arterial end-diastolic pressure (A), which can be used to estimate the pulmonary capillary wedge pressure (B), then the mean left atrial pressure (C). During ventricular filling we have the early diastolic pressure nadir “y” (D), which precedes the nadir “y” of left atrial pressure), the end-diastolic pre-A pressure (E) (which precedes atrial contraction), and the end-diastolic pressure proper (F, measured instead at the beginning of the increase in pressure of the isovolumic contraction).
ESTIMATION OF LV FILLING PRESSURES
The second aim of the analysis of LV DF in the clinical setting is the accurate (and preferably quantitative) estimation of LV FP. We have previously discussed that – based on the diagrams presented for the description of the determinants of LV DF – the LV FP increase progressively in parallel with the progressive impairment of LV DF, starting with a pattern of isolated prolonged relaxation and ending with a pattern reflecting the association of severely prolonged relaxation and increased chamber stiffness (Figures 3-5).
Filling pressures. Why have we talked so far about filling pressures (plural term)? As a matter of fact, the term “filling pressures” summarises the different filling pressures that can be measured at different time points during the cardiac cycle and at different locations between the pulmonary circulation and the LV cavity (Figure 14). It should be noted that before the introduction of the Swan-Ganz flotation catheter for the measurement of pulmonary capillary wedge pressure, the latter (and therefore mean LA pressure) was estimated by the measurement of the pulmonary artery end-diastolic pressure. It is important to recognize these different pressure points, since different Doppler methods and measurements relate to different filling pressure points (Figure 14). As such, the LV end-diastolic pressure is qualitatively estimated from the continuous Doppler deceleration profile of aortic regurgitation or from the M-mode mitral “B-bump” point; the pre-A end-diastolic pressure is qualitatively estimated by the combined use of transmitral and pulmonary venous flow (different duration of the anterograde and retrograde A waves); mean LA and pulmonary wedge pressures are estimated qualitatively using transmitral and pulmonary venous Doppler velocity profiles, semi-quantitatively adding annular tissue Doppler, and quantitatively by sampling with continuous wave Doppler the mitral regurgitation peak velocity or the pulmonary regurgitation end-diastolic velocity.
In Diastology, much of the previous and current literature has been based on the changes of the transmitral E wave secondary to the LV filling pressures changes. The first observations of a simple positive correlation between the peak of the E wave and LV filling pressures (5) have given way to a multivariate interpretation of the determinants of the E wave: filling pressures, LV relaxation and cardiac output. Thus, the numerically similar transmitral velocity profiles in a normal young subject and in a patient with a “pseudo-normal” physiology are explained (Figures 3-5) by the similar effect that an accentuated LV relaxation in the former, and an increase in LV filling pressures in the latter, have on the morphology of the E wave (peak E velocity and deceleration time).
Left ventricular end-diastolic pressure.
• The first “diastology” index used in echocardiography was the mitral M-mode “B-bump”, described in the 70s, which estimates (qualitatively) a high LV end-diastolic pressure. After the LA contraction, the mitral leaflets remain briefly open, in the absence of flow, due to the elevation of both LA and LV pressures in end-diastole. The subsequent LV contraction closes the mitral valve. Limits of the index: it cannot be used in the presence of mitral pathology, or the absence of a sinus rhythm.
• Aortic regurgitation PHT. The pressure half-time of the deceleration velocity of the continuous wave Doppler velocity profile of aortic regurgitation is inversely related to level (and progressive rise of) LV end-diastolic pressure. In a stiffer ventricle, the diastolic pressure rises more rapidly during diastole than in a ventricle with normal diastolic compliance, causing (for a similar decrease in aortic diastolic pressure) a faster reduction of the diastolic aortic-LV pressure difference (sampled by continuous wave Doppler), and therefore a shortening of the PHT time.
• The third much more recent index (17) is the time difference between the duration of the retrograde Ar wave of the pulmonary venous velocity profile and the duration of the anterograde mitral A wave (Ar-Adur, Table 3). A time difference > 30 ms estimates an increase in pre-A LV end-diastolic blood pressure (> 15 mmHg) (Figure 14). Limits: the measurement of the duration of the Ar wave has limited feasibility. It cannot be used in the presence of mitral valve pathology, or the absence of sinus rhythm.
Left ventricular minimum early diastolic pressure.
We do not have non-invasive indices available to estimate this pressure.