[Page 3]
BRIEF HISTORY OF THE METHOD
Since the first attempts in the 80s to estimate LV FP with echocardiography in patients with ischemic heart disease, major differences emerged between the different research groups concerning the correlations between the initial echocardiographic indices used (transmitral E and A waves peak velocities and ratio) and FP, both in baseline conditions (5-6) and during acute ischemia provoked by coronary angioplasty (7). These differences were mainly attributable to the different pathophysiological conditions (chronic vs. acute ischemia). The physiopathologic status is thus a main factor that modifies the correlations between echocardiographic indices and LV FP. The other factors subsequently established in the twenty years that preceded the 2009 Guidelines, and on which these were based, were:
1) the fact that LV relaxation and chamber compliance both modify directly but independently the indices derived from transmitral flow (8) (Figures 2 and 3);
2) the fact that, regardless of the type of heart disease, in most cases the progressive increase in LV FP modifies in parallel the transmitral and pulmonary venous flow profiles, with a seamless progression from flow profiles “dominated” by a prevalent prolongation of LV relaxation to flow profiles characterized by a prevalent impairment of LV chamber compliance (9) (Figure 3);
3) the important dependence of flow-based echocardiographic indices on LV preload, age (10), and heart rate and therefore a specific utility of indices derived from pulmonary venous flow, since they are less dependent on age and heart rate (Figure 3);
4) the prevailing influence of LV relaxation on the mitral annulus tissue Doppler peak early velocity (e’), which consequently positioned the E/e’ ratio at the heart of the 2009 and current Guidelines (1, 11) (Figures 4 and 5).
It is important to keep in mind that – since LV DF is also defined based on the interactions between LV volumes and pressures – all non-invasive analyses as the Doppler echocardiographic examination have the significant limitation of not being able to measure directly intracavitary pressures. However, the Doppler method – through the simplified Bernoulli equation (P1 – P2 = v2 x 4)- allows us to measure a local difference in pressure (P1 – P2, where the sampling is performed). Given this, knowing one of the 2 local pressures we can calculate by subtraction the second.
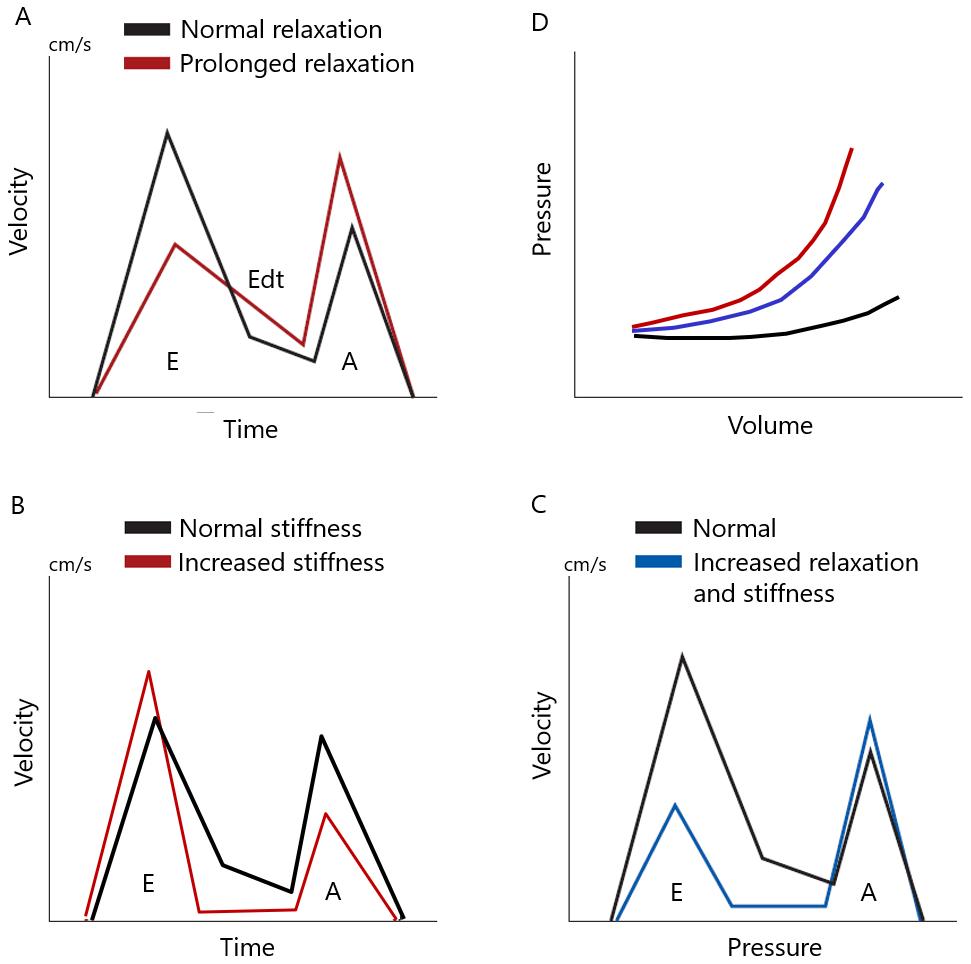
Figure 2. Influence of the main determinants of diastolic function (left ventricular chamber relaxation and compliance) on the transmitral flow profile.
A. Compared to a baseline transmitral flow profile of a 40-50 y. subject with normal ventricular function (black line in A), an isolated prolongation of relaxation with unchanged chamber stiffness (black pressure-volume curve in D) determines (red line in A): a reduction in the peak E velocity, a prolongation of the deceleration time Edt with widening of the E wave, and an increase in the peak A wave. In this setting, the prolonged relaxation causes a reduction in early rapid ventricular filling and a compensatory increase in end-diastolic filling secondary to atrial contraction. B. Compared to a baseline profile as above, an isolated increase in chamber stiffness (red pressure-volume curve in D) determines (red line in B): an increase in the peak velocity E, a reduction in the deceleration time of the E wave with a reduction in its duration, a reduction in peak A velocity. In this case, the increase in chamber stiffness causes a rapid increase in LV pressure in early diastole which rapidly decelerates early filling, whereas the elevated resulting end-diastolic ventricular pressure reduces the atrial contribution to left ventricular filling (= left atrial afterload mismatch). C. Effects of the simultaneous prolongation of ventricular relaxation and increase in chamber stiffness (ex: in acute ischemia) (blue line in D). In this setting, both end-diastolic ventricular pressure and atrial pressure increase, but the early diastolic atrio-ventricular pressure gradient is reduced as a result of the important prolongation (slowing) of relaxation which also causes an increase in the minimum LV early diastolic pressure (Figure 9). The reduction of the early diastolic atrio-ventricular pressure gradient (the main determinant of the E wave) determines the reduction of the peak E wave. The lack of a compensatory increase in the atrial contribution (A wave) to ventricular filling is explained by the atrial afterload mismatch mechanism: the increased end-diastolic ventricular pressure acts as increased left atrial afterload, thus reducing atrial systolic function.