[Page 15]
Left atrial mean pressure / pulmonary capillary wedge.
• By combining the measurements of the transmitral flow velocity profile (E/A ratio, E wave deceleration time) with those of the pulmonary venous flow profile (Si/Di) (Table 3), it is possible to distinguish the different pathophysiologic profiles of “prolonged relaxation “(DD grade I), “pseudo-normal” (DD grade II) and “restrictive” (DD grade III) filling, which point to a progressive increase in mean LA (Figures 3-5) from normal / initially elevated (Grade I), to high (grade II) and to very high (grade III). This type of evaluation is very accurate in the follow-up of the individual patient, less so when used to compare patients. Limitations: This method cannot be used in the presence of mitral valve pathology, absence of sinus rhythm, presence of ≥moderate mitral regurgitation.
• The most widely used (and controversial) index, cornerstone of the current and previous Guidelines (1, 10), is the E/e’ ratio, used both to distinguish the different degrees of DD and to estimate the average LA pressure (18) (Table 3). If used individually, it recognizes two cutoffs of 8 and 15 to identify patients with normal (<8 mmHg) and high (> 15 mmHg) LV filling pressures, while for intermediate values (8-15 mmHg), it is necessary to implement other indices or the Valsalva maneuver. The rationale for its use is based on the direct relation between LV relaxation and peak e’. Unlike the transmitral peak E wave which is reduced in the diastolic “prolonged relaxation” profile, and then progressively increases in the “pseudo-normal” and “restrictive” profiles (Figure 3-5), the mean e’ peak (average of septal and lateral values) will be equally reduced (<8 cm/s) in the 3 different pathologic diastolic filling profiles (Figures 3-5). Consequently, if we consider the ratio between mitral peak E and annular peak e’ (the E/e’ ratio), it will vary in the different profiles as a function of the variation of the peak E velocity. Let’s examine this relationship more closely:
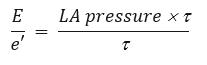
In this equation, the transmitral peak E velocity is broken up into its 2 main determinants: LA mean pressure and LV relaxation (t). We have already said that e’ is mainly determined by t. Thus, simplifying the equation for t,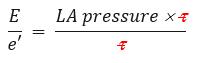 We are left with this equivalence:
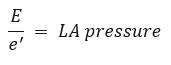
Limits: presence of mitral valve disease; factors that limit/alter the motion of the mitral annulus (ex: ischemia/scar of the LV base segments of the lateral wall or inferior septum); presence of moderate to severe mitral regurgitation. Finally, several authors have highlighted how the presence of a normal ejection fraction strongly reduces the correlation between E/e’ and mean LA pressure.
• Continuous wave Doppler sampling of mitral regurgitation provides a direct quantitative measure of mid-systolic LA pressure (which approximates mean LA pressure), using the formula:
mean LA pressure (mmHg) = sphygmomanometric systolic blood pressure – peak LV-LA pressure difference.
The peak LV-LA pressure difference is measured using the simplified Bernoulli equation applied to measurement of the peak velocity of mitral regurgitation. The method is possible in the presence of a well-defined velocity-time spectrum of mitral regurgitation and with a simultaneous measurement of sphigmomanometric brachial arterial pressure (which approximates peak LV systolic pressure, in the absence of LVOT obstruction or aortic valve stenosis).
Pulmonary end-diastolic pressure.
The rationale for using pulmonary end-diastolic pressure in “diastology” is based on the fact that this pressure, in the absence of high pulmonary vascular resistances, accurately estimates the pulmonary capillary wedge pressure, and therefore the mean LA pressure (Table 3).
• Continuous wave Doppler sampling of pulmonary regurgitation (Figure 15) provides a direct quantitative measure of pulmonary end-diastolic pressure, using the formula:
pulmonary end-diastolic pressure (mmHg) = end-diastolic pressure difference between the pulmonary artery and the right ventricle + right ventricular end-diastolic pressure.
The first term is obtained – using the simplified Bernoulli equation – by measuring the end-diastolic pulmonary regurgitation peak velocity (after the notch due to right atrial contraction). The right ventricular end-diastolic pressure, on the other hand, in the absence of tricuspid stenosis, is equivalent to the mean right atrial pressure, which in echocardiography is obtained from the assessment of the inspiratory collapse of the inferior vena cava (normal collapse= 6 mmHg; 35-45% collapse= 9 mmHg; no collapse <25%= 16 mmHg) (19). Sampling of pulmonary regurgitation has a high feasibility (> 80%) with modern echocardiographic machines, because it can usually be performed in the presence of trace regurgitation (20). Limitations: high pulmonary vascular resistance and pre-capillary pulmonary hypertension.
We have recently published a study validating an algorithm aimed at estimating LV filling pressure (PCWP), prioritizing the non-invasive estimation of pulmonary diastolic pressure (Figure 16b, next page).
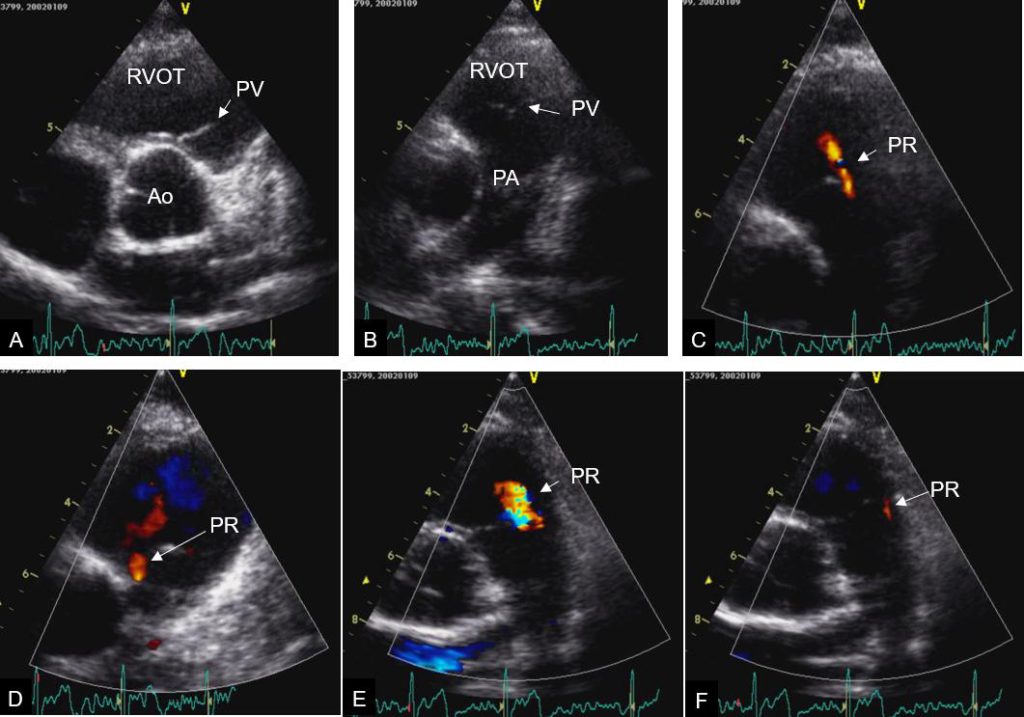
Figure 15a. Pulmonary valve anatomy and examples of color Doppler pulmonary regurgitation. Examples of 2D and color Doppler visualization of pulmonary valve and pulmonary regurgitation. A: Short axis of the base centered on the aortic root. B: Short axis of the base centered on the pulmonary artery. C: trace pulmonary regurgitation, central jet. D: trace pulmonary regurgitation, medial commissural jet. E: mild pulmonary regurgitation, central jet. F: trace pulmonary regurgitation, lateral commissural jet.
Ao: aortic root; PA: pulmonary artery; PR: pulmonary regurgitation; PV: pulmonary valve; RVOT: right ventricular outflow tract;
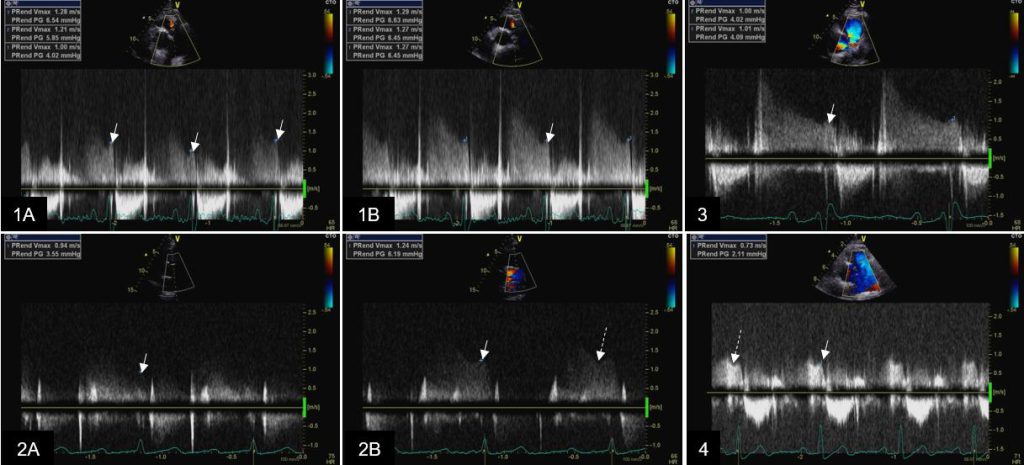
Figure 15b. Examples of continous wave Doppler sampling of pulmonary valve regurgitation velocity profiles. Examples of continuous wave Doppler tracings of pulmonary regurgitation velocities (without use of contrast).1A: Variability of end-diastolic velocity during quiet respiration; 1B: Stable end-diastolic velocity at held end-expiration; 2A: sub-optimal recording secondary to suboptimal visualization of pulmonary regurgitant jet; 2B: optimal end-diastolic velocity recording secondary to modification of scan line alignment with regurgitant jet; 3: Pulmonary regurgitation with 2 regurgitant jets, minimal central and mild commissural (posterior): optimal alignment of continuous wave scan line with the commissural jet; 4. Visualization limited to end-diastolic velocity may be sufficient if the notch caused by atrial contraction (secondary to increase in right ventricular end-diastolic pressure) is recorded. White arrow points at pulmonary regurgitation end-diastolic velocity; long dashed arrow points at atrial contraction notch
See also here in this website.