Left Ventricular Analysis, Systole, M-mode
M-mode analysis of left ventricular systolic function
February 14th, 2021
(update April 29th, 2022)
Pages 1 – 2
Table of Contents
- Isovolumetric contraction time
- Mitral valve E-septum separation
- Systolic excursion of aortic root
- Short axis fractional shortening
- Left ventricular wall thickening
Isovolumetric contraction time
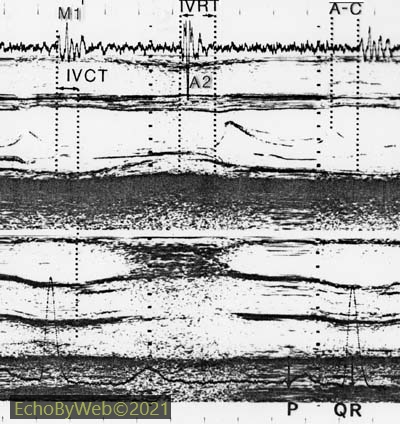
Figure 1. Superimposed and synchronized M-mode tracings of the left ventricle with mitral valve (upper panel) and aortic root (lower panel). Phonocardiographic tracing at upper end and ECG tracing at lower end of figure.
A2: First high frequency component of second heart sound on phonocardiogram.
A-C: Time interval between A (peak anterior movement of anterior leaflet during atrial contraction) and C (mitral valve closure) points of M-mode mitral valve tracing.
IVCT: Isovolumetric contraction time.
IVRT: Isovolumetric relaxation time.
M1: First high frequency component of first heart sound on phonocardiogram.
P: ECG P wave
QR: Q and R wave of the ECG.
Mitral valve E-septum separation
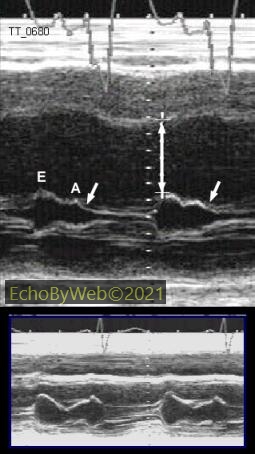
Figure 2A. The separation is measured as the distance between the E point of the mitral valve and the corresponding (synchronous) interventricular left septal endocardium (vertical white arrow). Normal value < 6 mm. The small arrow points at the B-bump sign (see here).
[References: Massie BM et al, Am J Cardiol 1977;39:1008-16. D’Cruz IA et al, Clin Cardiol 1979;2:140-5].
Distance between white dots (depth) = 10 mm
Normal mitral valve morphology and dynamics are shown in the lower panel (Figure 2B and C).
B. Left panel: mitral valve stenosis. Right panel: dilated cardiomyopathy.
Mitral E-septum separation cannot be used when mitral valve motion is restricted by valve stenosis. In this setting, the measurement does not reflect left ventricular dilatation and systolic dysfunction
C. Left panel: normal LV. Right panel: increased E-septum separation (vertical thick arrow).
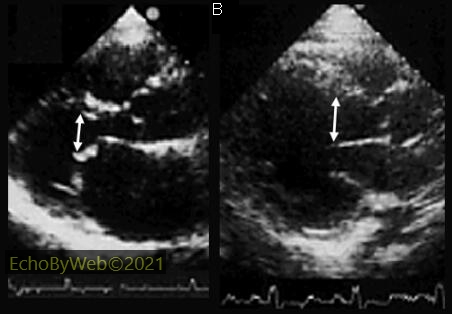
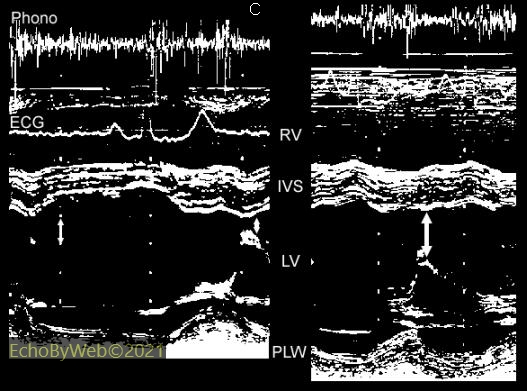
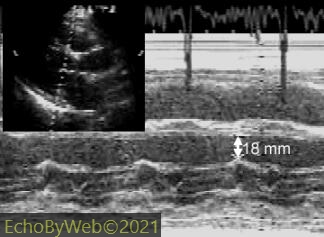
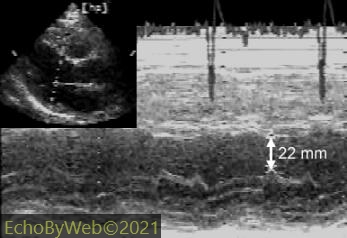
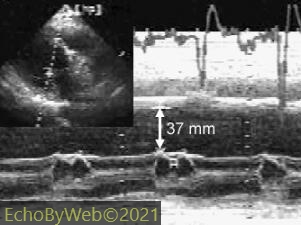
Figure 3 a to C. Progressive left ventricular dilatation and reduction of ejection fraction. Mitral E-septum separation increases with both ventricular dilatation and reduction of systolic function.
A: End-diastolic volume= 135 ml and EF= 54 %
B: End-diastolic volume= 170 ml and EF= 55 %
C: End-diastolic volume= 233 ml and EF= 33 %