LV Analysis, Diastole
Analysis of Left Ventricular End-Diastolic Pressure
February 14th, 2021
(updated April 14th, 2022)
For a Review of LV diastolic function, see in this website: A Brief Review of Left Ventricular Diastolic Function and Dysfunction.
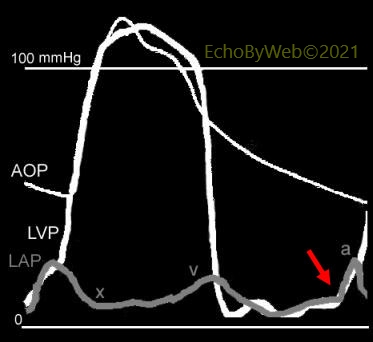
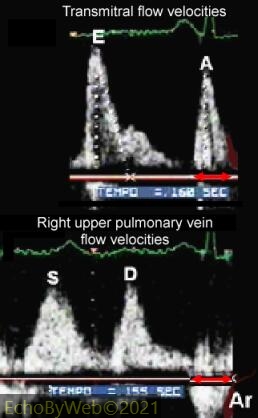
Figure 1. Non-invasive estimation of LV end-diastolic “pre-a wave” pressure [Rossvoll et al., J Am Coll Cardiol 1993;21:1687-96].
Calculated difference between the duration of the transmitral A wave (Fig. 2, upper panel, “A”) and the pulmonary vein retrograde A wave (Fig. 2, lower panel, “Ar”). Normal LV pre-a wave pressure: A – Ar > 0 ms.
Increased LV pre-a wave pressure (> 15 mmHg): A – Ar < 0 (Sensitivity= 85%, Specificity= 79%). Velocity calibration (distance between white dots) = 20 cm/sec.
Figure 2. AOP: Aortic pressure tracing; LAP: left atrial pressure; tracing; LVP: left ventricular pressure tracing: a: left atrial peak a wave pressure: v: left atrial peak v wave pressure: x: left atrial x pressure trough: red arrow: pre-a wave pressure point.