[Page 6]
Phases of diastole. The classical clinical subdivision of the diastolic filling period recognizes 4 phases (Figures 6a, 6b and 7). The isovolumic relaxation begins with the closure of the aortic valve cusps, followed by a rapid pressure drop in the presence of slight changes in the geometry of the LV chamber but without changes in volume (since both aortic and mitral valves are closed). When the LV pressure falls below the left atrial (LA) pressure (“cross-over” pressure point, immediately after the LA pressure “v” peak and before the LV pressure “y” nadir), the mitral valve opens the phase of rapid filling begins, which lasts about one-third of diastole, and during which about 80% of LV filling occurs. Once relaxation is complete, LV filling continues by inertia and following the interaction of the different LV and LA chamber stiffness: LV filling is facilitated by a higher compliance of this chamber compared to that of the LA. Less than 5% of ventricular filling occurs during this phase in a normal ventricle. Finally, about 5-15% of LV filling occurs following LA contraction in a relatively young subject, with a heart rate around 60 bpm (Figures 6 a and 6b). It should be remembered that the characteristics of LV filling (early-diastolic relaxation and mid-to-end diastolic compliance) influence LV systolic function and cardiac output through the Frank-Starling relationship, which relates positively preload and output (Figure 7): an improvement of LV filling increases LV preload and therefore stroke volume (with unchanged LV contractility and afterload).
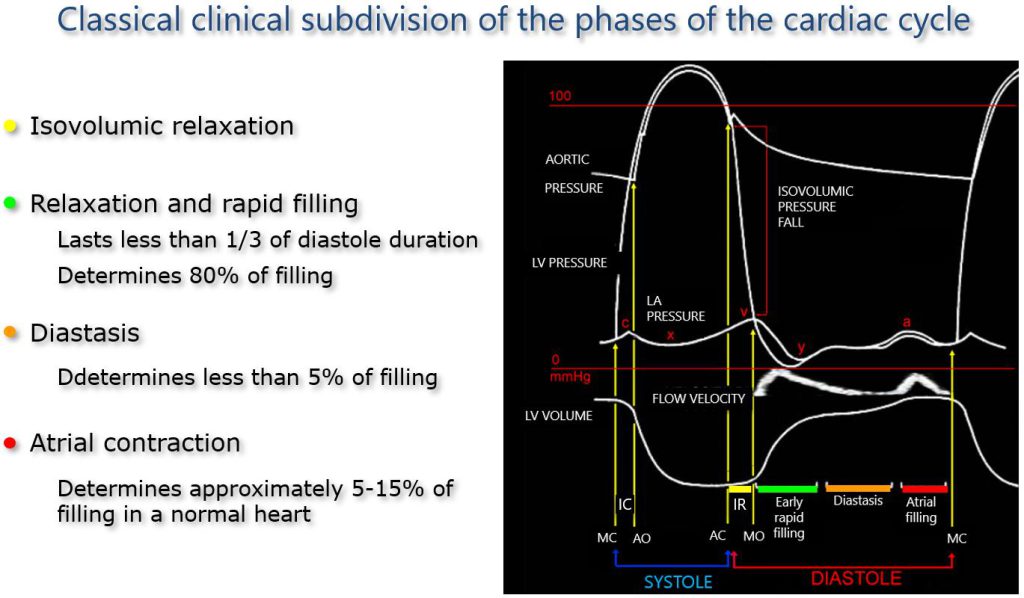
Figure 6a. Phases of diastolic function.
Left: the 4 phases of the diastolic function. Yellow: IR; Green: Early rapid filling; Orange: Diastasis; Red: Atrial contraction.
Right, from top to bottom, synchronized: aortic pressure; left ventricular pressure; left atrial pressure; transmitral flow velocity profile; left ventricular volume.
AC: aortic valve closure; AO: aortic valve opening; IC: isovolumic contraction; IR: Isovolumic relaxation; MC: mitral valve closure; MO: mitral valve opening.
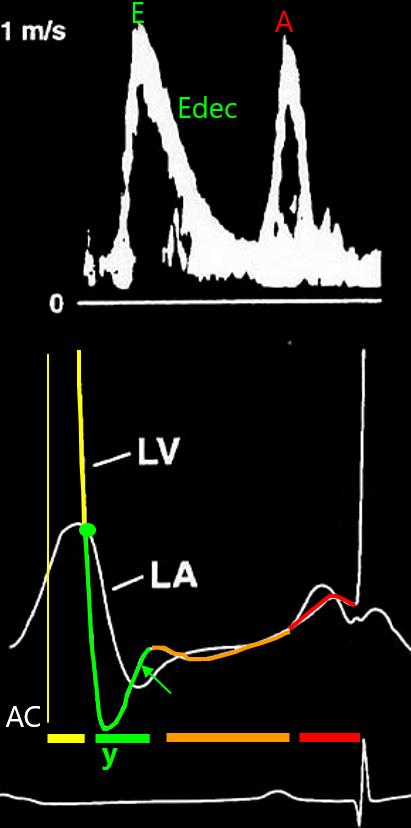
Figure 6b, The LA-LV pressure gradient.
Upper panel: pulsed Doppler trans-mitral flow velocities. Lower panel: High-fidelity LV and LA pressure tracings.
Yellow: Isovolumic relaxation phase with rapid drop of LV pressure until the “cross-over” pressure point with LA pressure (green point), which determines the onset of the E wave.
Green: early rapid LV filling phase; the LV pressure drops rapidly below LA pressure (white line) producing a pressure gradient between the LA and LV chambers (A-V), which drives LV filling and determines the E wave velocity characteristics (rate of velocity increase and peak E velocity). After the “y” LV pressure nadir, the rapid rise in LV pressure determines the E wave deceleration rate (and time, Edec). Flow stops when the A-V gradient reverses (green arrow).
Orange: Diastasis phase. A minimal varying A-V pressure gradient may be observed.
Red: LA contraction phase, with a positive A-V pressure gradient.
A: peak A wave velocity; AC: Aortic valve closure; A-V: atrio-ventricular pressure gradient;l E: peak E wave velocity; Edec: E wave deceleration time; LA: Left atrial; LV: Left ventricular; y: early diastolic LV pressure nadir.
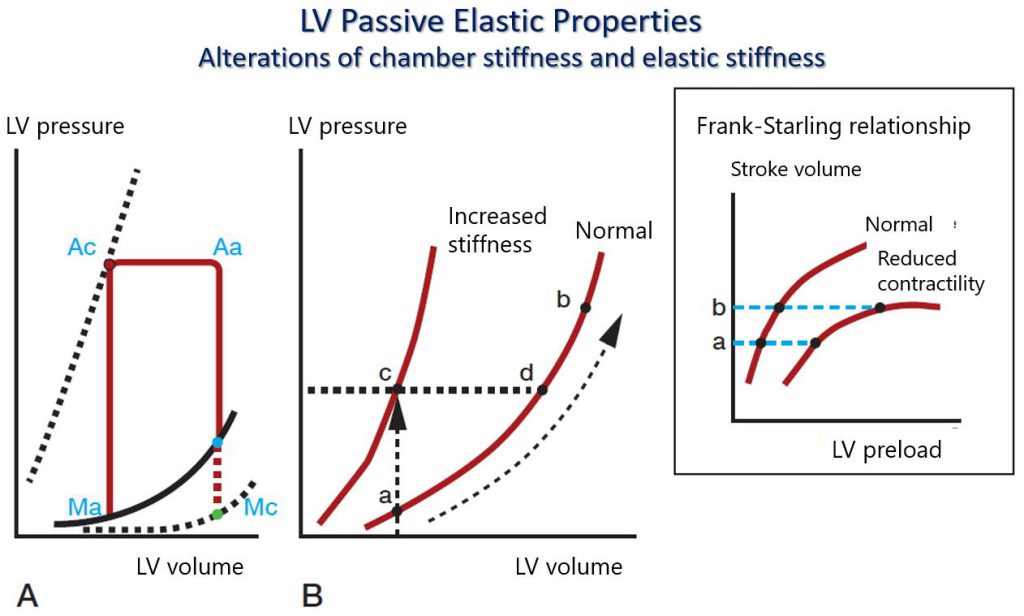
Figure 7. Pressure-volume loop.
Graphical representation of the Interaction between ventricular pressure and volume during the cardiac cycle. A. The left ventricular pressure-volume loop. Beginning in the end-diastole, ventricular contraction causes the mitral valve to close (Mc) followed by a rapid rise in pressure during the isovolumic contraction phase until aortic valve opening (Ao). The aortic valve opens when the ventricular pressure exceeds the aortic diastolic pressure, and ventricular ejection occurs with a reduction in the ventricular volume and slight changes in intraventricular pressure, until the end-systolic point when aortic valve closure occurs (Ac). Ventricular relaxation begins in mid-systole and drives (after Ac) a rapid ventricular pressure drop during the isovolumic relaxation phase and – after mitral valve opening (Mo) – during early ventricular filling. Ventricular filling proceeds after Mo in parallel with a slight increase in ventricular pressure until atrial contraction at end-diastole, the closure of the mitral valve (Mc), and the beginning of the isovolumic contraction period. It should be noted that ventricular chamber stiffness will increase with the increase of the filling pressure or the filling volume (volume overload) even in a normal ventricle, beyond a certain preload value. The black dotted exponential line on the lower right represents the normal diastolic pressure-volume curve, whereas the black continuous exponential line represents the pressure-volume curve of a ventricle with increased stiffness (the curve is shifted up and to the left compared to the normal curve). The black dotted straight line represents the end-systolic pressure-volume relationship, which describes ventricular contractility. B. The graph shows a normal end-diastolic pressure-volume curve (on the right) and a second curve shifted to the left representing increased chamber stiffness. In the latter – at similar ventricular volume – end-diastolic pressure is increased (c) compared to normal (a). Of note, end-diastolic pressure will increase significantly (from “d” to “b”) with increasing filling volume (volume overload), also in a normal ventricle when a certain degree of preload is reached (curve on the right).
Ac: aortic valve closure; Ao: aortic valve opening; LV: left ventricular; Mc: mitral valve closure; Mo: mitral valve opening.