[Page 12]
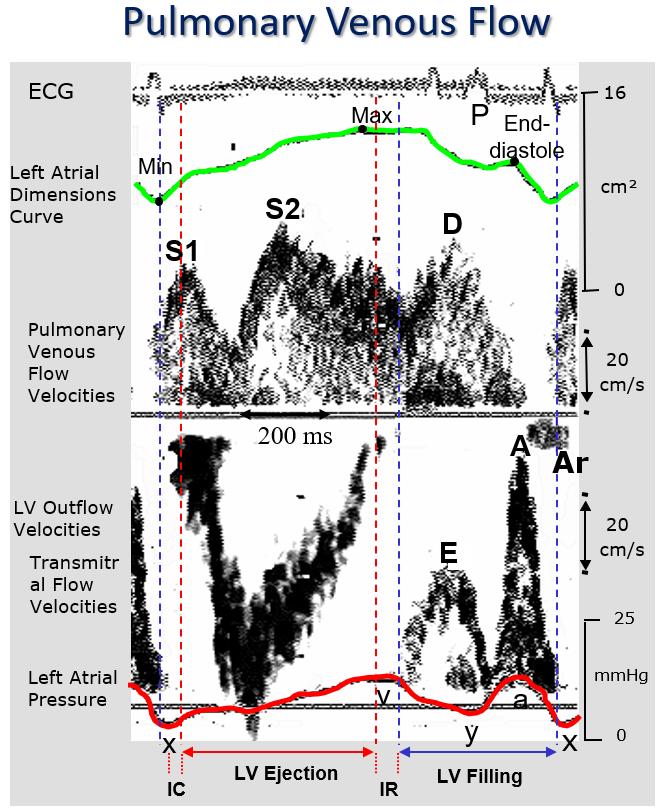
Figure 12 Left atrial physiology.
From top to bottom: ECG; left atrial dimensional curve (4-chamber echocardiographic area); pulmonary venous flow velocity profile; left ventricular outflow tract velocity profile; transmitral flow velocity profile; left atrial high-fidelity pressure curve (Millar catheter).
After atrial contraction (systole), atrial pressure reaches its minimum (“x” nadir) during atrial relaxation, synchronous with the acceleration of the first systolic peak (S1) of pulmonary venous flow. After relaxation, atrial filling continues along its pressure-volume curve (atrial chamber compliance) synchronous with the second pulmonary venous systolic wave S2 wave, which also occurs at the same time of the left ventricular outflow wave, until the maximum end-systolic left atrial dimensions immediately before the opening of the mitral valve. The antegrade pulmonary venous diastolic wave D is synchronous with the transmitral flow E wave, and both occur during ventricular relaxation (early rapid ventricular filling). In this phase, the atrium empties passively (with an elastic recoil) into the ventricular chamber. The atrial contraction determines the atrial mechanical systole, the transmitral A wave and the (minimal) reflux Ar wave in the pulmonary vein from the atrium.
a: left atrial “a” pressure point (atrial systole); A: transmitral end-diastolic A wave; Ar: pulmonary venous end-diastolic retrograde wave; D: pulmonary venous diastolic forward wave; E: transmitral early diastolic wave; IC: isovolumic contraction; IR: isovolumic relaxation; LV: left ventricular; Max: maximum left atrial area; Min: minimum left atrial area; P: ECG P wave: S1: pulmonary venous early systolic wave; S2: pulmonary venous late systolic wave; x: left atrial “x” nadir pressure point; y: left atrial “y” pressure nadir point.
Pathophysiology. To understand the pulmonary venous flow profile it is necessary to refer to LA physiology, which is complementary to LV systolic-diastolic physiology (Figure 12) (13). The first systolic wave (S1) of LA filling follows immediately the retrograde end-diastolic wave (due to LA systole) and results from LA relaxation. The second, prevailing systolic wave (S2) is inversely related to LA pressure and LA stiffness, and directly related to LA total filling during LV systole. The total systolic velocity-time integral is related to cardiac output (14). The velocity profile of the antegrade diastolic wave reflects both the previous LA filling during LV systole and the characteristics of LV early diastolic filling. As seen for the transmitral flow profile, it is possible to differentiate the effects of a prolonged LV relaxation from those of a reduction in LV chamber compliance on the pulmonary venous flow velocity profile (Figures 3-5). Both in normal conditions and in the presence of prolonged LV relaxation, the pulmonary venous velocity profile shows a prevalence of the systolic wave (positive Si/Di ratio), also called a “systolic dominant” profile. With the progressive reduction of LV chamber compliance (and the increase in LA pressure), the ratio decreases with a prevalence of the diastolic wave, and the profile is denominated “diastolic dominant”, as a result of a simultaneous reduction of the systolic wave (due to a reduction in LA compliance) and an increase of the diastolic wave (parallel to the increase in the transmitral E wave, see above). Accordingly, there is an inverse relationship between the Si/Di ratio and the pulmonary capillary wedge pressure (= mean LA pressure) (15). Similarly as described for the transmitral flow profile, we observe a seamless progression from a normal flow pattern to that which results from a LV “restrictive” filling pathophysiology, following an increase in LA and LV diastolic pressures (Figure 3-5). The advantage of integrating the information obtained from the pulmonary venous flow profile with that obtained from the transmitral profile is twofold:
1) we can easily distinguish a normal transmitral profile from a pseudonormal one because the first corresponds to a “systolic dominant” pulmonary venous profile, and the second to a “diastolic dominant ” profile (Figures 3-5);
2) we can distinguish during tachycardia an “impaired relaxation” (low LV filling pressures) profile from a “restrictive” (high LV filling pressures) profile because, unlike the transmitral profile which becomes monophasic and uninterpretable, the pulmonary venous systolic and diastolic waves are still recognizable during tachycardia.