[Page 8]
F. Apical Views, Evaluation of the Aortic and Mitral Valves – 心尖图
2D video clip. Apical 3-chamber view, optimized for mitral and aortic valve. Evaluation of mitral and aortic valve anatomy.
Position markers, visualization of:
1. Maximum LV longitudinal axis;
2. Maximum diastolic excursion of mitral leaflets;
3. Maximum systolic excursion of aortic valve cusps.
2D动态图像. 3腔图,优化左房图像
CD video clip. Apical 3-chamber view. Visualization of aortic and mitral valve flow. Locate and maximise regurgitant jet location / direction, and evidence of valve stenosis (aliasing). Identification of a Proximal Isovelocity Surface Area (PISA) if aortic or mitral valve regurgitation is present.
彩色多普勒动态图像. 3腔图,主动脉瓣血流和二尖瓣血流;放大图像,找到返流的射流位置/方向
CD video clip. Apical 4-chamber view, mitral valve flow. Locate and maximise regurgitant jet location / direction; identification of a Proximal Isovelocity Surface Area (PISA) if regurgitation is present; pulmonary venous flow; evidence of intera-atrial shunt (atrial septal defect).
彩色多普勒动态图像4腔图,二尖瓣血流;放大图像,找到返流的射流位置/方向
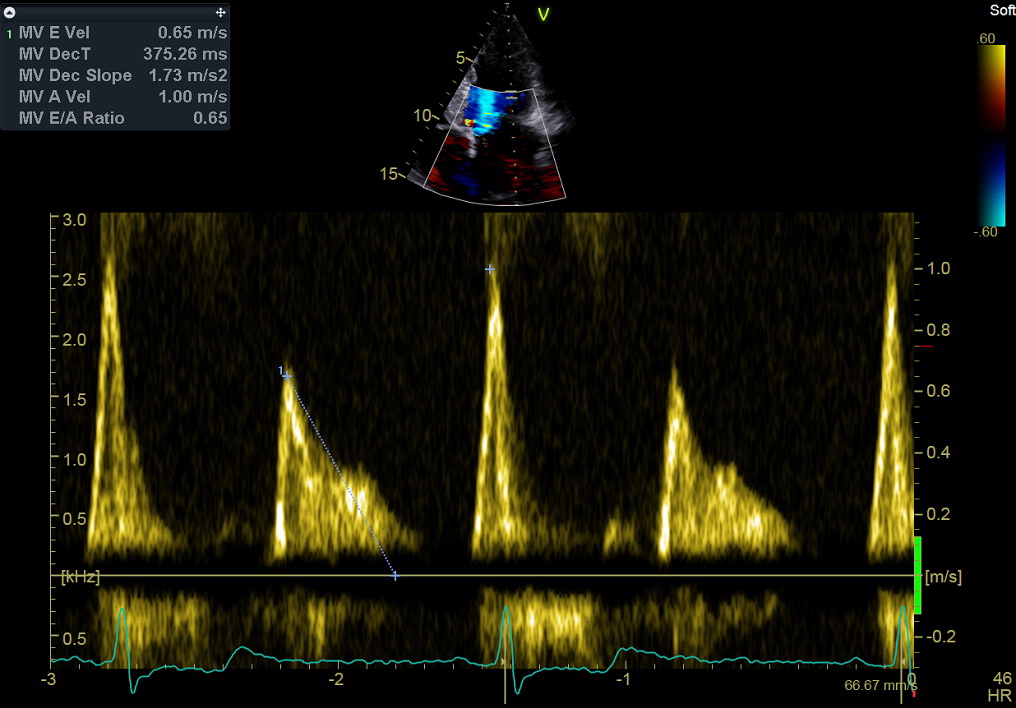
Pulsed Doppler still frame. Mitral valve flow velocity profile. Measurement of peak E wave (Ep) and A wave (Ap) velocity (see Normal values here), and E wave deceleration time (Edec or Edt). See also the measurement methodology for mitral valve flow here, in the Brief Review of Left Ventricular Diastolic Function and Dysfunction.
脉冲多普勒图像. 描绘二尖瓣血流,测量:E峰,A峰,E波减速时间
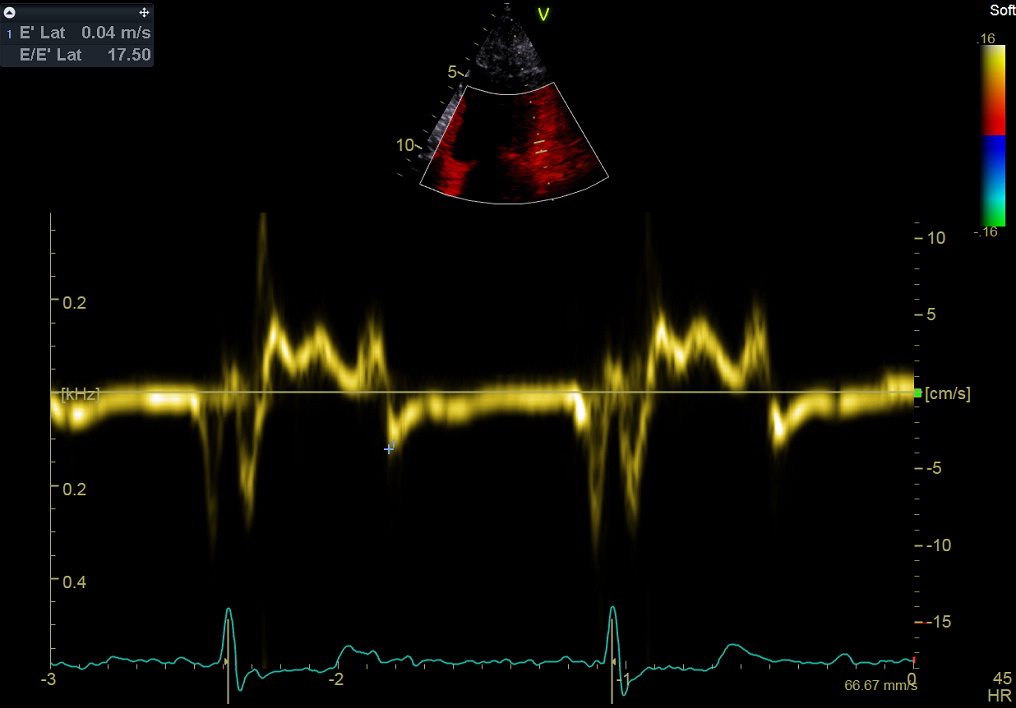
Tissue Doppler Imaging still frame. Mitral valve lateral annulus tracing, Measurement of peak early diastolic velocity (e’); see Normal values here and here.
See also the measurement methodology for mitral annulus tissue Doppler here, in the Brief Review of Left Ventricular Diastolic Function and Dysfunction.
This measurement, combined with the septal annulus and the mitral peak E wave, is used to estimate left ventricular filling pressures.
组织多普勒图像. 追踪二尖瓣侧面瓣环,测量:e’峰
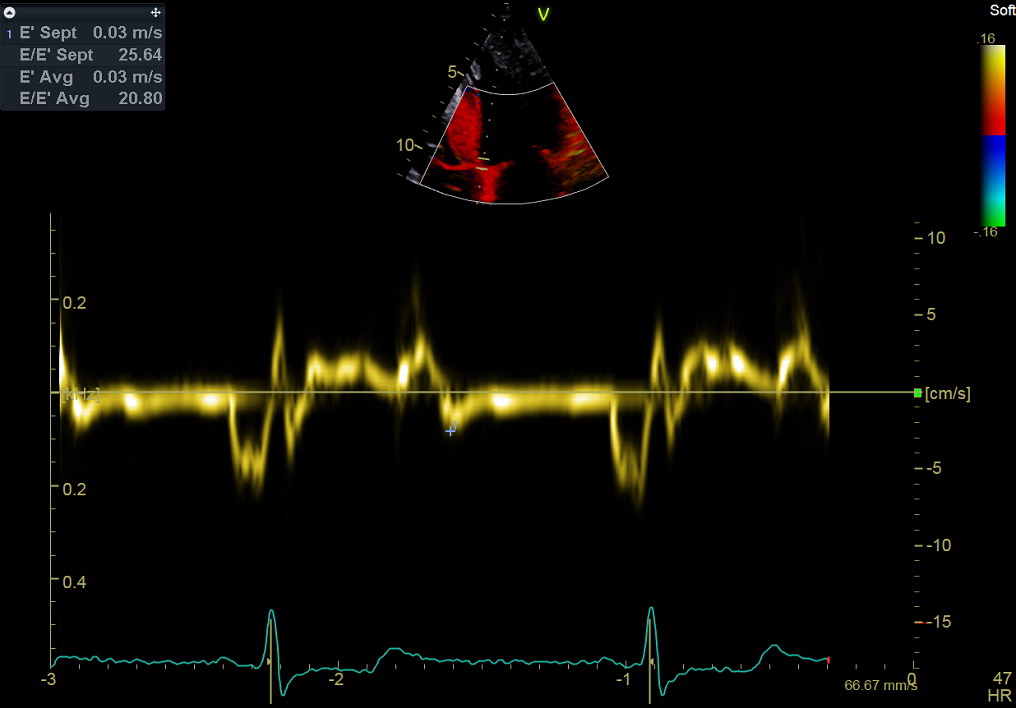
Tissue Doppler Imaging still frame Mitral valve septal annulus tracing, Measurement of peak early diastolic velocity (e’); see Normal values here and here.
annulus tissue Doppler here, in the Brief Review of Left Ventricular Diastolic Function and Dysfunction.
This measurement, combined with the lateral annulus and the mitral peak E wave, is used to estimate left ventricular filling pressures.
组织多普勒图像. 追踪二尖瓣底部瓣环,测量:e’峰