[Page 11]
G. Apical Views, Evaluation of the Right Ventricle – 心尖图
2D video clip. 4-chamber view optimized for the right ventricle (maximum long axis). Position markers, visualization of:
1. Maximum ventricular longitudinal axis;
2. Maximum diastolic excursion of tricuspid leaflets.
Evaluation of wall motion. Planimetry for calculation of Fractional Area Change. See Normal values here.
2D动态图像. 右室优化的4腔图(长轴最大化);评估室壁运动
CD video clip. Apical 4-chamber view optimized for the tricuspid valve flow (regurgitation). Locate and maximise regurgitant jet location / direction. Exclude valve stenosis (aliasing).
彩色多普勒动态图像4-. 三尖瓣血流(返流)优化的4腔图;放大图像,找到返流的射流位置/方向
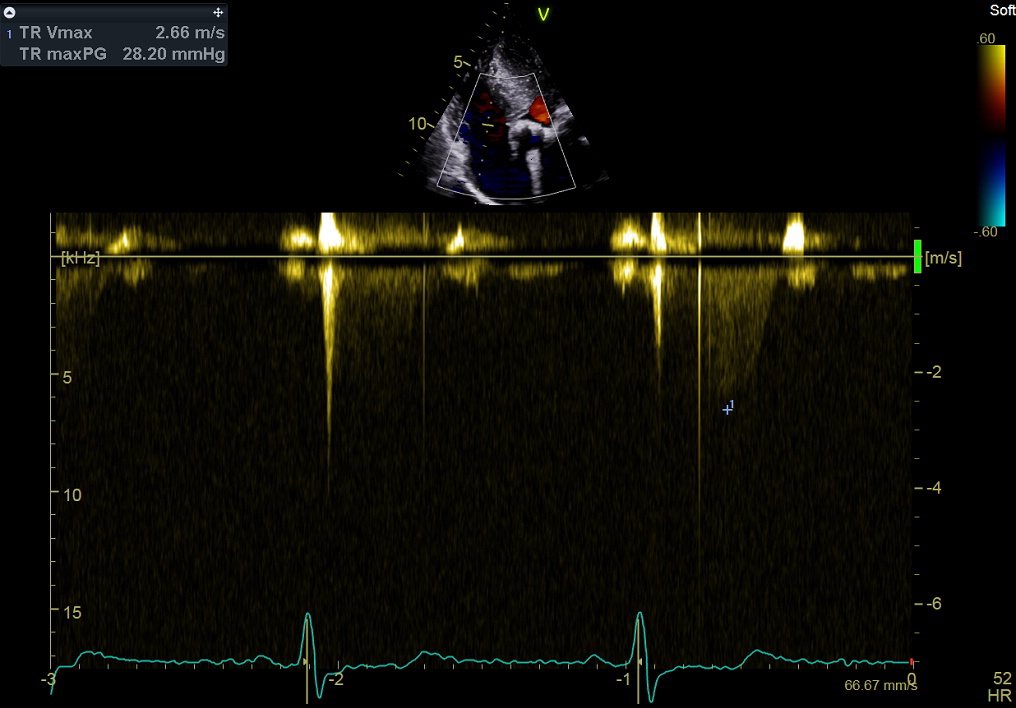
Continuous wave Doppler still frame. Tricuspid regurgitation: measurement of peak mid-systolic velocity. Purpose: to estimate right ventricular systolic pressure (see online Calculator here), combined with estimation of right atrial pressure (inspiratory collapsibility of the inferior vena cava, see Page 12).
This measurement – together with the right ventricular outflow tract time-velocity integral – is currently used in a validated formula to estimate also pulmonary vascular resistances (see Online Calculator here).
Note that peak tricuspid regurgitant velocity should be evaluated in multiple views.
连续波多普勒图像. 三尖瓣返流; 测量:最大流速
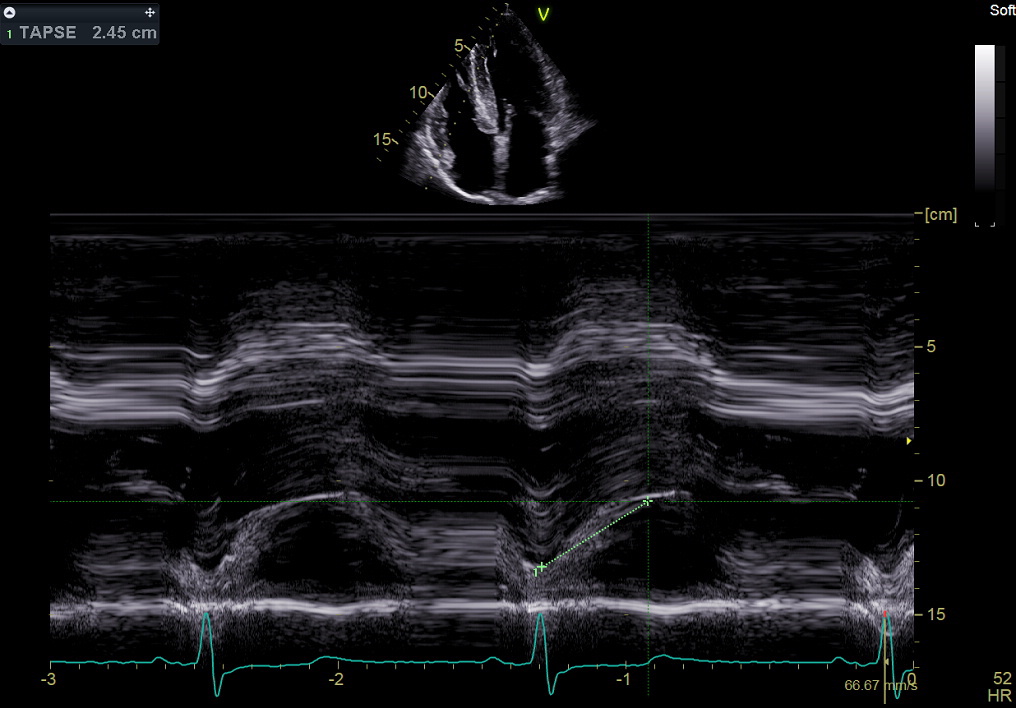
M-mode still frame. M-mode measurement of TAPSE. This measurement is used to estimate right ventricular longitudinal systolic function. See Normal values here.
M模图像. 三尖瓣环收缩期位移