[Page 10]
G. Apical Views, Evaluation of the Left Ventricle – 心尖图
2D video clip. Apical 4-chamber view optimized for the left ventricle (maximum long axis). Transducer position: 0° in the transverse plane (see Figure 31). It is necessary to be on the true apex, in farthest and lowest position possible.
Position markers, visualization of:
1. Maximum longitudinal LV long axis;
2. Maximum diastolic excursion of mitral leaflets
Evaluation of wall motion.
2D动态图像. 左室优化的4腔图(长轴最大化);评估室壁运动
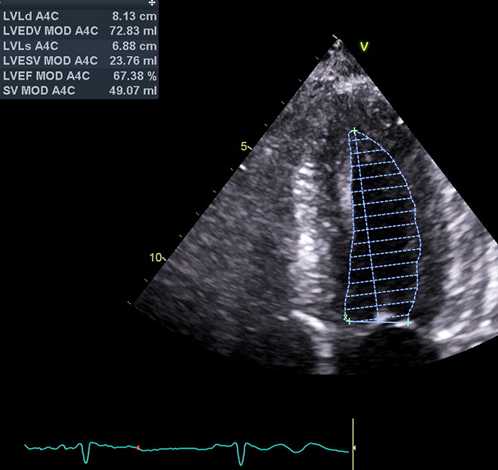
2D still frame. Apical 4-chamber view optimized for the left ventricle (maximum long axis). Measurements: ventricular area planimetry to calculate LV biplane volumes and ejection fraction (see Normal values here); evaluation of wall motion.
2D图像. 左室优化的4腔图(长轴最大化);测量:量左室面积来计算左室双平面容积;评估室壁运动
2D video clip. 2-chamber view optimized for the left ventricle (maximum long axis). Transducer position: 60°-90° anticlockwise rotation (see Figure 34); often 1 intercostal space upwards (compared to the 4-chamber view), on anterior apex.
Position markers, visualization of:
1. Maximum LV longitudinal axis;
2. Maximum diastolic excursion of mitral leaflets;
3. Short axis of coronary sinus (inferior);
4. LA appendage (anterior).
Evaluation of wall motion
2D动态图像. 左室优化的2腔图(长轴最大化);评估室壁运动
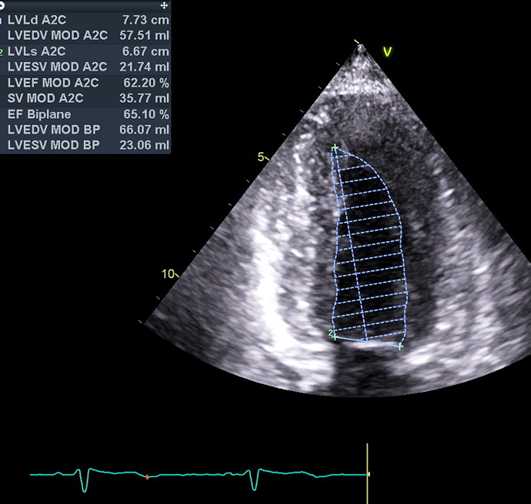
2D still frame.Apical 2-chamber view optimized for the left ventricle (maximum long axis). Measurements: ventricular area planimetry to calculate biplane volumes and ejection fraction (see Normal values here); evaluation of wall motion
2D图像. 左室优化的2腔图(长轴最大化)测量:量左室面积来计算左室双平面容积;评估室壁运动
2D video clip. Apical 3-chamber view optimized for the left ventricle (maximum long axis). Transducer position: approximately 120° anticlockwise rotation (see Figure 36).
Position markers, visualization of:
1. Maximum LV longitudinal axis;
2. Maximum diastolic excursion of mitral leaflets;
3. Maximum systolic excursion of aortic valve cusps.
Evaluation of wall motion.
2D动态图像. 左室优化的3腔图(长轴最大化);评估室壁运动