[Page 7]
Systolic / diastolic collapse of the RA wall.
Collapse of the RA wall. The collapse begins in early systole (FIgures 39-40), then progressively extends to the whole of systole and only subsequently also to the diastolic phase along with the increase of the pericardial pressure. It is not a sign of tamponade, but only a sign of an initial increase in pericardial pressure (relative to right atrial pressure).
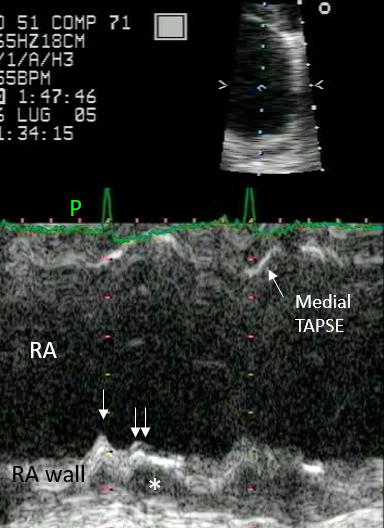
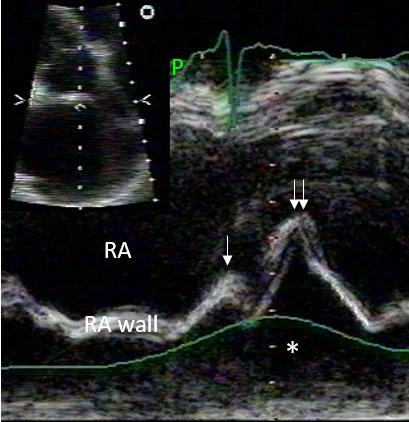
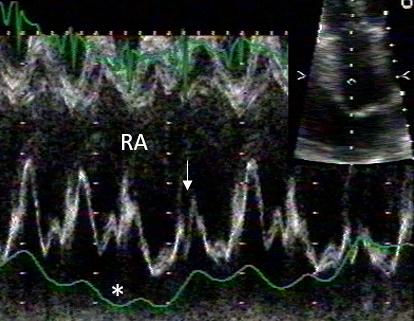
Early systolic collapse of the RA wall. There is mild effusion superior to the RA (Figure 39), with apparent systolic motion of the superior RA wall, which is better appreciated with the superior time resolution of M-mode (Figure 40): the single arrow points to physiologic late diastolic inward motion of the RA wall, which follows the ECG P wave (P) and represents atrial systole. The double arrow points to the small early systolic collapse of the RA wall, secondary to a minimal increase in pericardial pressure with effusion (asterisk).
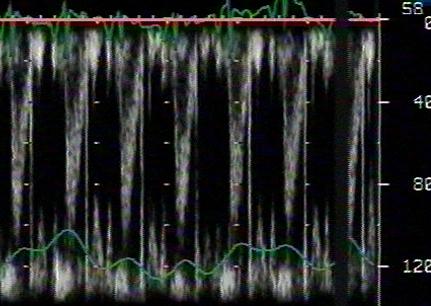
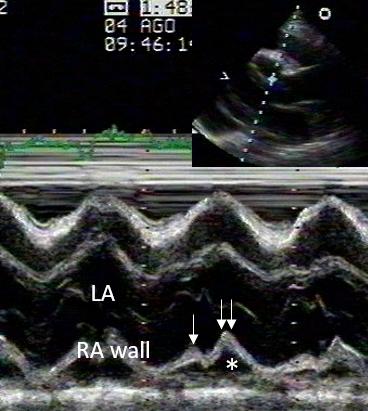
Holosystolic collapse of the RA wall. There is severe diffuse pericardial effusion, with systolic inward motion of the RA wall. The M-mode exam of the RA wall (Figure 42) shows atrial systolic contraction (single arrow) followed by holosystolic wall collapse (double arrow). In this case, pericardial pressure is higher but there is no tamponade: no respiratory variation of LV outflow tract velocities (Figure 43). Figure 44 shows the same pattern for the LA posterior wall in the same patient.

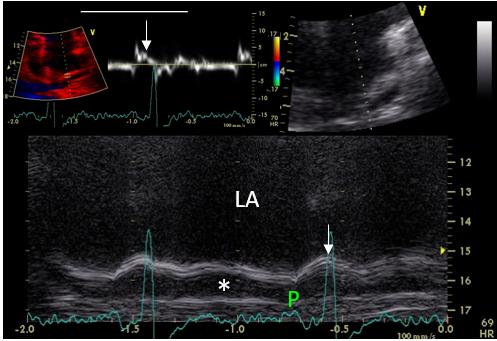
In this patient with mild effusion (asterisk) superior to both atria (Figure 45), the inward motion of the RA (Figure 46) and LA (Figure 47) walls only represents atrial systole, since it follows the ECG P wave and occurs in late diastole (white arrows). This is also confirmed by pulsed tissue Doppler of the superior LA wall in Figure 45.
Influence of respiration on pericardial transmural pressure.
During inspiration, the increase in RA pressure reduces pericardial transmural pressure and the systolic inward motion of the RA wall (white arrow).