[Page 2]
Pericardial Compressive Syndromes
Constrictive pericarditis, pericardial tamponade and restrictive cardiomyopathy are 3 conditions characterized by reduced diastolic filling (reduced volume, increased diastolic pressures, reduced diastolic compliance). Both pericardial tamponade (pericardial space filled with incompressible fluid) and constriction (pericardial thickening with no distensibility) can be considered as pericardial compressive syndromes.
Pericardial compressive symptoms
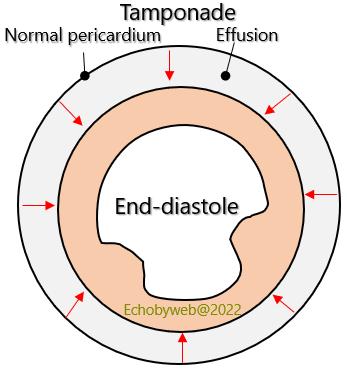
Pericardial tamponade
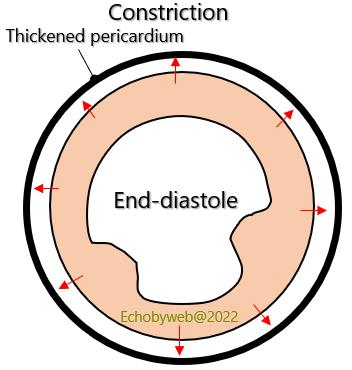
Pericardial constriction
Hemodynamic similarities:
- Diastolic dysfunction of the ventricular chamber
- Preserved LV systolic function
- Equilibrium of diastolic pressures
- Increased Central Venous Pressure
- Reduced Cardiac Output
- Increased respiratory variations of the ventricular filling velocities
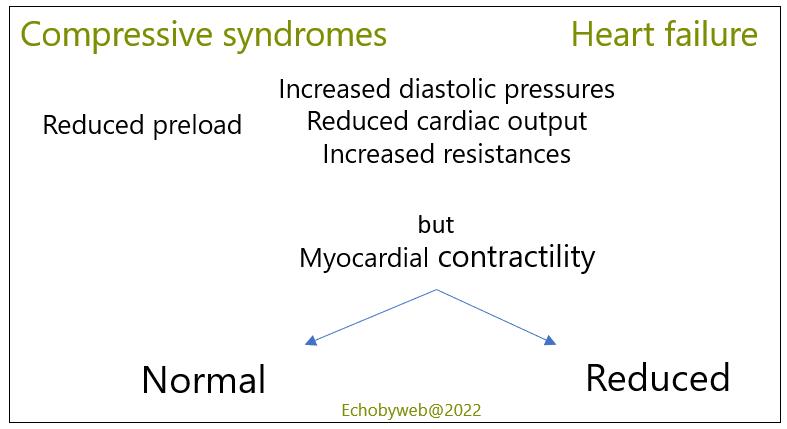
Analogies between the 2 conditions of compressive heart syndromes and heart failure (Figure 5):
Cardiac output is reduced at rest or if not during exercise. This results in compensatory tachycardia (mediated by increased sympathetic tone that also increases vascular resistances).
The syndrome (low output + increased diastolic pressure + increased vascular resistances) simulates heart failure, but there is no myocardial dysfunction. Since pulmonary diastolic pressure is rarely increased (increased only if there is associated cardiopathy), it is similar to the filling pressures of both ventricles.
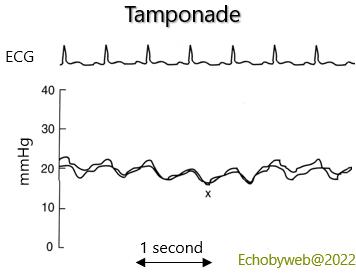
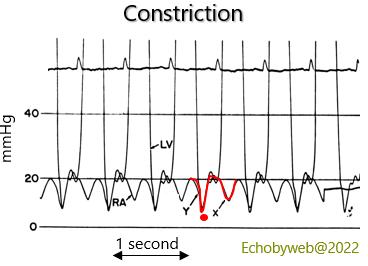
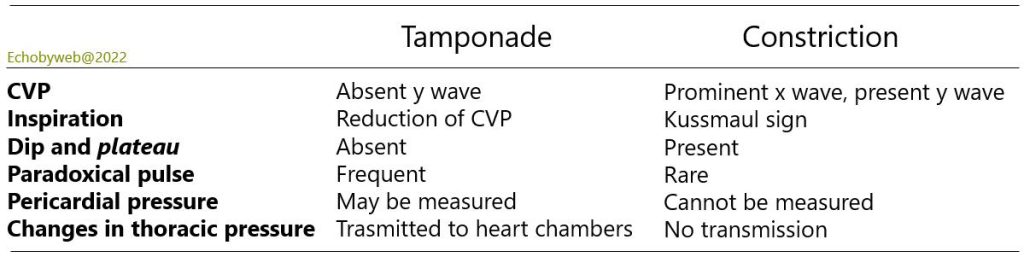
Hemodynamic differences between Tamponade and Constriction.
During tamponade, end-diastolic volume is smaller than in constriction. The heart is constricted also in end-systole. In constriction atrial venous return is bi-modal (y + x waves, as in normal physiology), whereas in tamponade it is unimodal (single x wave).
CVP: centraL venous pressure
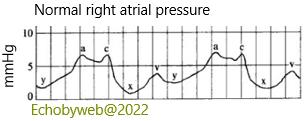
The “a”wave marks the increase in atrial pressure following atrial contraction (immediately following the ECG P wave). The “x” descent follows the decrease in pressure driven by atrial relaxation, with an intermediate small positive “c” wave caused by the closure of the tricuspid valve during the isovolumetric contraction of the right ventricle. After the “x” nadir the atrial pressure increases with atrial filling from the superior and inferior vena cava during ventricular systole (while the tricuspid valve is closed), reaching a “v” pressure peak. After this peak, there is a rapid decline in pressure until the “y” nadir, caused by left ventricular relaxation and rapid emptying of the atrium in the ventricle. The atrial pressure then rises again during ventricular diastole (continuous inflow from the superior and inferior vena cava) until atrial contraction.
See here for a discussion of normal and pathologic atrial pressure waveforms.