[Page 12]
Pericardial Constriction
“Constrictive pericarditis is a rare but severely disabling consequence of the chronic inflammation of the pericardium, leading to an impaired filling of the ventricles with reduced function.”
Pericardial Diseases Guidelines, Eur Heart J 2004;25:587.
Clinical picture
– Asthenia and shortness of breath
– Signs of venous congestion (giugular distension, peripheral edema, ascites)
– Reduction of cardiac output
The pericardial thickening / adhesions can be:
– Diffuse (global)
– At the atrio-ventricular junction (symmetrical or prevalently right / left)
– Along the left or right ventricular free wall
– With or without associated atrophy of the underlying myocardium (to a varying extent).
Hemodynamics.
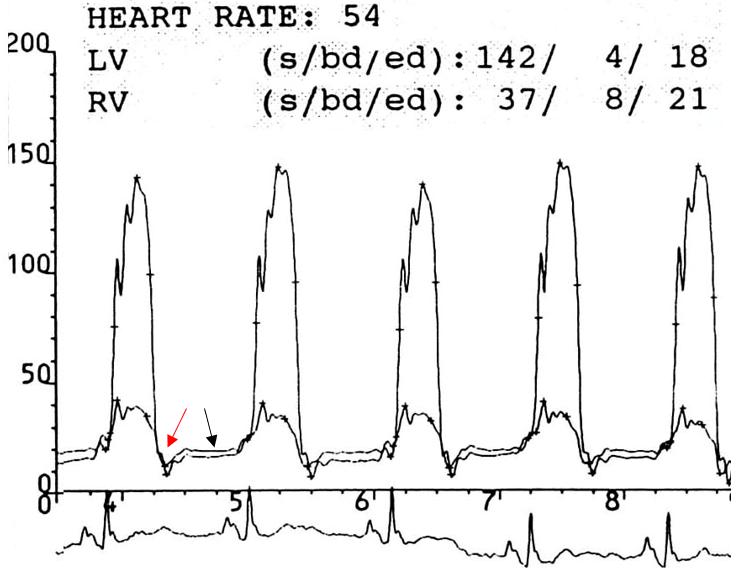
– Increased right and left ventricular diastolic pressures with equalization (within 5 mmHg) (Fig. 79)
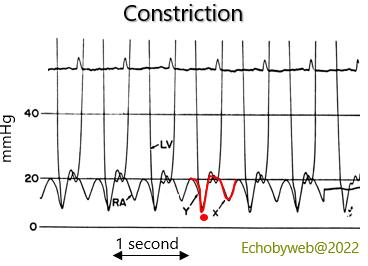
– “Dip and plateau” pattern of right and left diastolic pressures (Fig. 78 and 79, red arrow= “dip”, black arrow= “plateau” ).
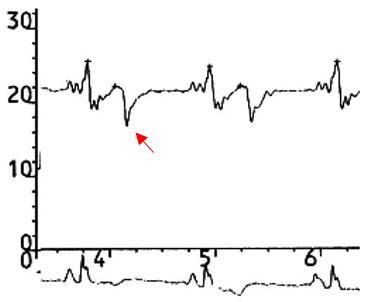
– “W“ pattern of the right atrial pressure curve with prevalent “y” nadir (Fig. 78 and 79, red arrow= “y” nadir)
– Inspiratory increase in right atrial pressure (Kussmaul sign)
– Reduction of cardiac output, which may be preserved by tachycardia
Seminal paper by prof. L. Hatle: Differentiation of constrictive pericarditis and restrictive cardiomyopathy by Doppler echocardiography. Circulation 1989;79:357.
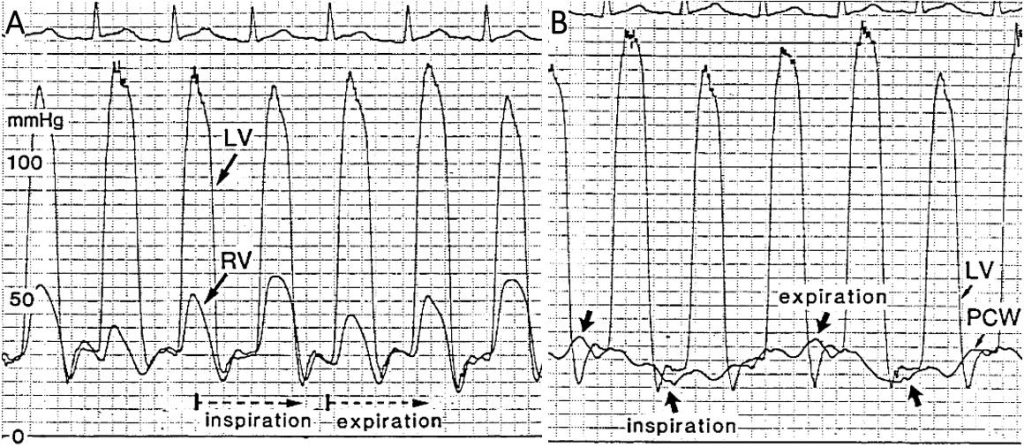
Figure 81. The right ventricular pressure increases during inspiration while systolic and diastolic LV pressures are decreasing (Fig. 81, left panel). The respiratory variations of the pulmonary wedge pressure (PCW) are greater than those of LV diastolic pressure (Fig. 81, right panel), leading to a reduction in the difference between wedge pressure and LV pressure during inspiration – which decreases the mitral peak E wave – and an increase of the pressure difference during expiration which causes an increase in the mitral peak E wave. Maximum peak E wave velocity is regularly observed at the first expiratory beat.
Figures 81-82. A case of outcomes of partial pericardiectomy with pericardial thickening and adhesions of the LV postero-lateral wall. There are no signs of pericardial constriction.
Figure 83-85. Pericardial constrictive syndrome after aortic valve replacement (Carpentier bioprosthesis) and CABG.
Note abnormal septal motion with abrupt leftwards shift during inspiration (Fig. 83) and pericardial adhesions of the LV lateral wall (Figs. 84 and 85).