[Page 2]
Evaluation of LV filling pressures.
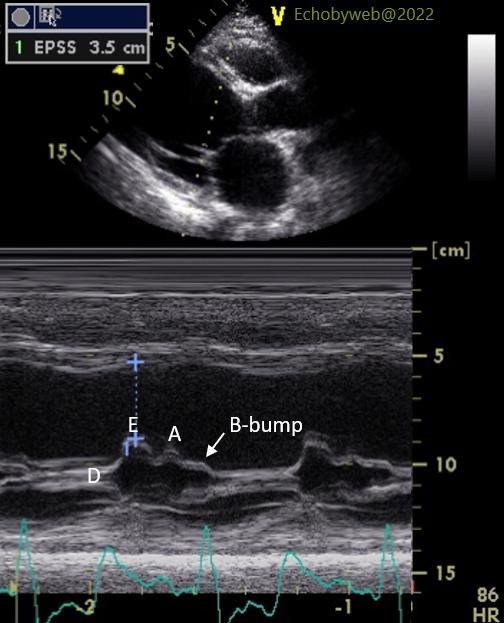
On the M-mode examination of the mitral valve (Figure 3), the E-septal separation is very large (35 mm) in keeping with severely dilated LV with reduced systolic function. Further, the M-mode B-bump is prominent, and this specifically points to an increase in LV end-diastolic pressure.
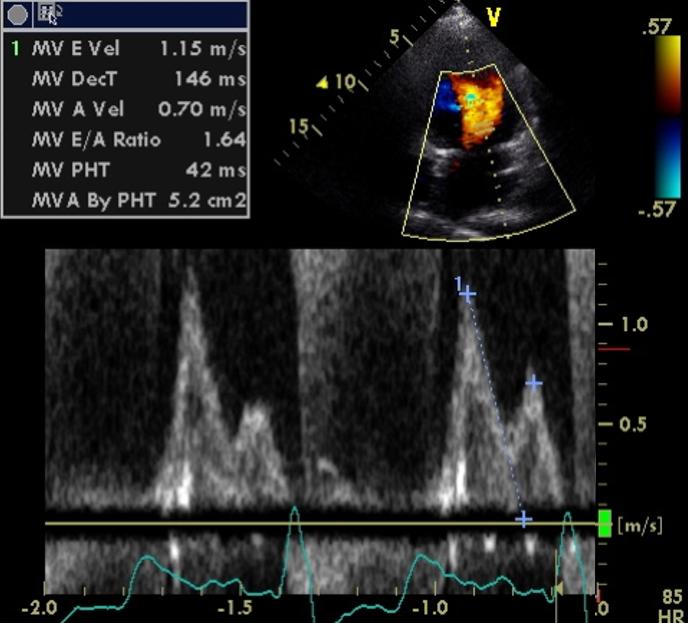
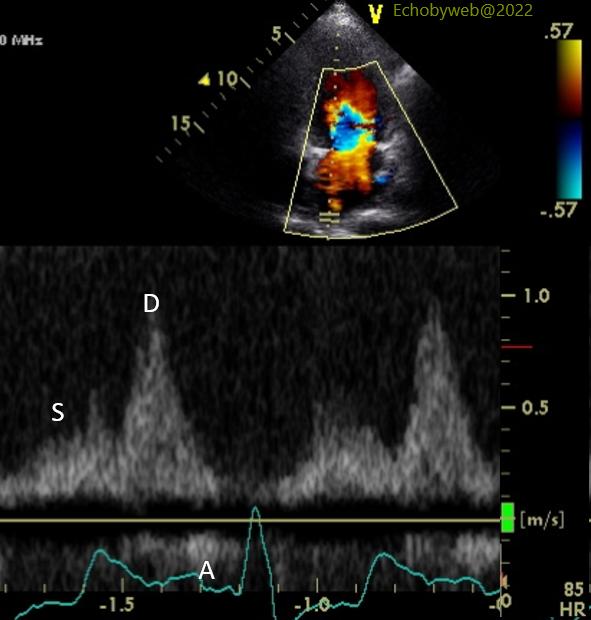
The analysis of LV diastolic function and estimation of filling pressures with mitral valve flow (Figure 4), pulmonary venous flow (Figure 5), and tissue Doppler imaging of the septal and lateral mitral annulus (not shown) points to a Diastolic Dysfunction Class III (restrictive type physiology) and increased filling pressures (as suggested by the M-mode B-bump). Specifically, both peak E wave velocity (115 cm/s) and the mitral E/A ratio (1.6) are high, the E wave deceleration time is short (146 ms), and the pulmonary venous flow profile is diastolic dominant (prevalent D wave).
Compare to normal filling pressure patterns here.