[Page 5]
Figures 13 to 15 show 3 examples of calculation of stroke volume and cardiac output in a normal subject (Figure 13, bradycardia with increased stroke volume), in a patient with cirrhosis (Figure 14, tachycardia with preserved cardiac output), and in a patient with dilated cardiomyopathy (Figure 15, reduced cardiac output).
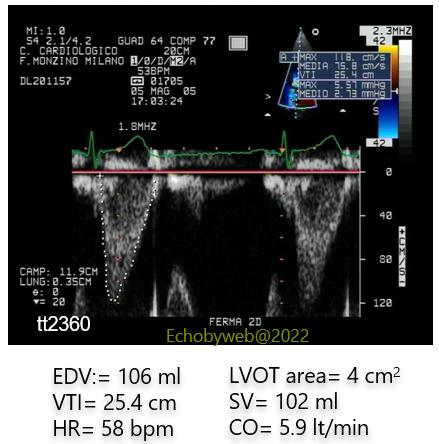
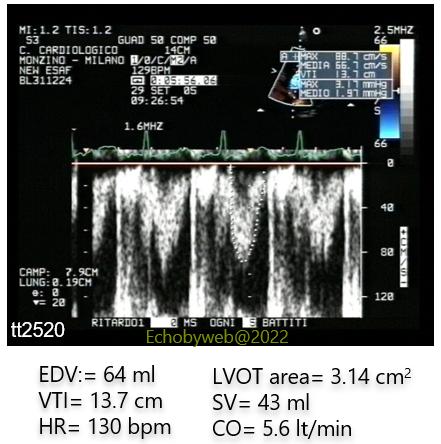
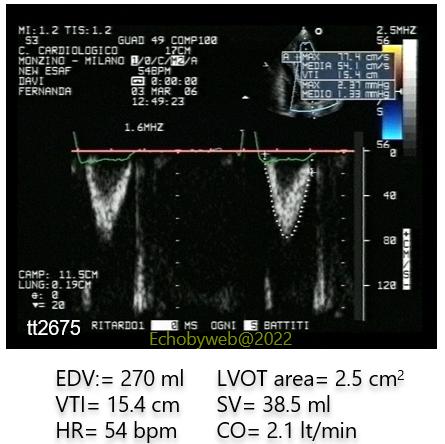
CO: cardiac output; EDV: end-diastolic volume; HR”: heart rate; LVOT: LV outflow tract; SV: stroke volume; VTI: pulsed Doppler flow velocity-time integral .
Although stroke volume can also be calculated with 2D-derived LV end-diastolic and end-systolic volumes (see Page 1 of this lesson), this latter estimation is far less accurate than the pulsed Doppler estimation (personal data from the Author).