[Page 2]
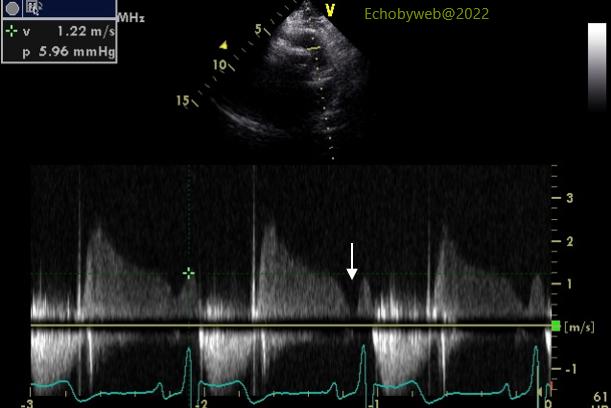
Moving to noninvasive hemodynamics, we evaluate LV diastolic function and filling pressures. This evaluation is important because an increase in filling pressures without other causes may suggest “significant” mitral regurgitation (in the Guidelines this generic adjective usually translates as moderate-to-severe or severe regurgitation), and explain shortness of breath associated with the regurgitation, whereas a normal filling pressure would exclude such association. A normal atrial reservoir function has already suggested normal LV filling pressure (= mean atrial pressure), and this is confirmed by continuous wave Doppler analysis of the physiologic pulmonary regurgitation (Figure 3) which estimates normal pulmonary diastolic pressure.
Pulmonary diastolic pressure correlates closely with pulmonary capillary wedge pressure and the latter with mean left atrial pressure, if pulmonary vascular resistances are normal. Since pulmonary systolic pressure and stroke volume are normal in our patient, we can assume that resistances are normal.
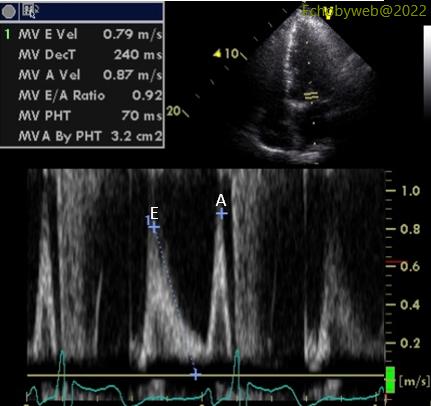
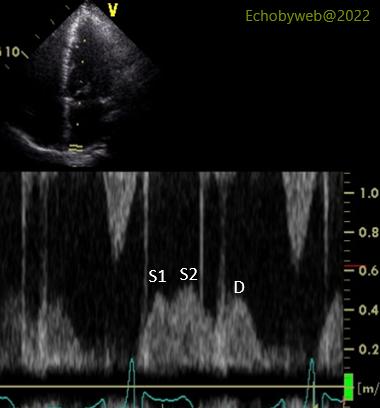
A normal mean atrial pressure is also suggested by the mitral valve flow velocity profile (Figure 4, E/A ratio and deceleration time) and the right upper pulmonary vein flow profile (Figure 5, systolic dominant= the total velocity-time integral of the systolic waves S1 and S2 is greater than that of the diastolic wave D).