[Page 2]

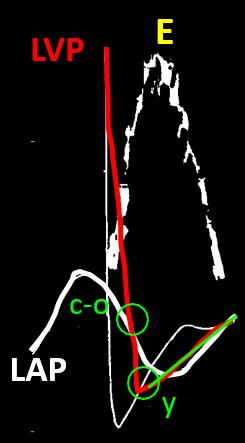
Figure 3. Early diastole with left atrial (LA) pressure tracing (LAP, white), LV pressure tracing (LVP, red) and pulsed Doppler mitral valve flow E wave (E) in a normal subject. The yellow double arrow is the maximum LA-LV pressure difference; the green slope is the early diastolic LV pressure rise after the “y” nadir; c-o: LV-LA pressure cross-over; y: LV pressure early diastolic nadir.
This diagram shows the interactions in early LV diastole of LV and LA pressures and the resulting mitral E wave acceleration, peak velocity and deceleration in a normal subject. The c-o pressure crossover determines the opening of the mitral valve and the beginning of trans-mitral flow. The “y” nadir marks the timing of the maximum LA-LV pressure difference (yellow arrow) and determines the timing and value of the peak E wave velocity. The early diastolic LV pressure rise (green slope) determines the E wave deceleration slope and time (Edt).
So, coming back to our young normal subject (Figure 1), the higher peak E wave velocity (compared to the patient of Figure 2) is determined by a “normal – high” early diastolic LA-LV pressure gradient, dominated by a steep, fast decline of LV pressure which is determined by a fast, normal LV relaxation. LA pressure is normal and also declines rapidly during early LV diastole (LAP). The small but fast increase in LVP after the y nadir (green slope) determines the short E wave deceleration time that we see in normal young hearts or athletes.

Figure 4. Early diastole with left atrial (LA) pressure tracing (LAP, white), LV pressure tracing (LVP, red) and pulsed Doppler mitral valve flow E wave (E) in a patient with prolonged relaxation. The thin white line represents LVP in a normal subject (as in Figure 1). c-o: LV-LA pressure crossover; y: LV pressure early diastolic nadir; the green slope is the early diastolic LV pressure rise after the “y” nadir.
In the setting of pathologically prolonged relaxation:
1. LVP decline is slow and the c-o pressure crossover occurs later at a lower pressure value
2. The “y” nadir pressure is higher such that the LA-LV pressure difference (not shown) is smaller than in Figure 3.
3. Subsequently, the rise in LVP in early and mid diastole is slower.
This hemodynamic pattern determines, respectively:
1. A later onset of the E wave (thus the Isovolumic Relaxation Time is prolonged)
2. A smaller peak E wave velocity
3. A prolonged E wave deceleration time.
These are the main considerations to make when evaluating both normal and prolonged relation pulsed Doppler mitral valve flow profiles.
Please see: A Brief Review of Left Ventricular Diastolic Function and Dysfunction on this website to put this Post on LV relaxation in the wider context of the pulsed Doppler analysis of LV diastolic function and dysfunction.
References
- Nagueh SF, Smiseth OA, Appleton CP, et al. Recommendations for the Evaluation of Left Ventricular Diastolic Function by Echocardiography: An Update from the American Society of Echocardiography and the European Association of Cardiovascular Imaging. Eur Heart J Cardiovasc Imaging 2016.
- Mantero A, Gentile F, Azzollini M, Barbier P, Beretta L, Casazza F, Corno R, Faletra F, Giagnoni E, Gualtierotti C, Lippolis A, Lombroso S, Mattioli R, Morabito A, Ornaghi M, Pepi M, Pierini S, and Todd S. Effects of sample volume location on Doppler-derived transmitral inflow velocity values in 288 normal subjects 20 to 80 years old : an echocardiographic, two-dimensional color Doppler cooperative study. J Am Soc Echocardiogr 1998 ;11 :280-8.