[Page 3]
AFI (Automated Function Imaging) calculations.
See normal AFI strain values and segmental curves in this website.
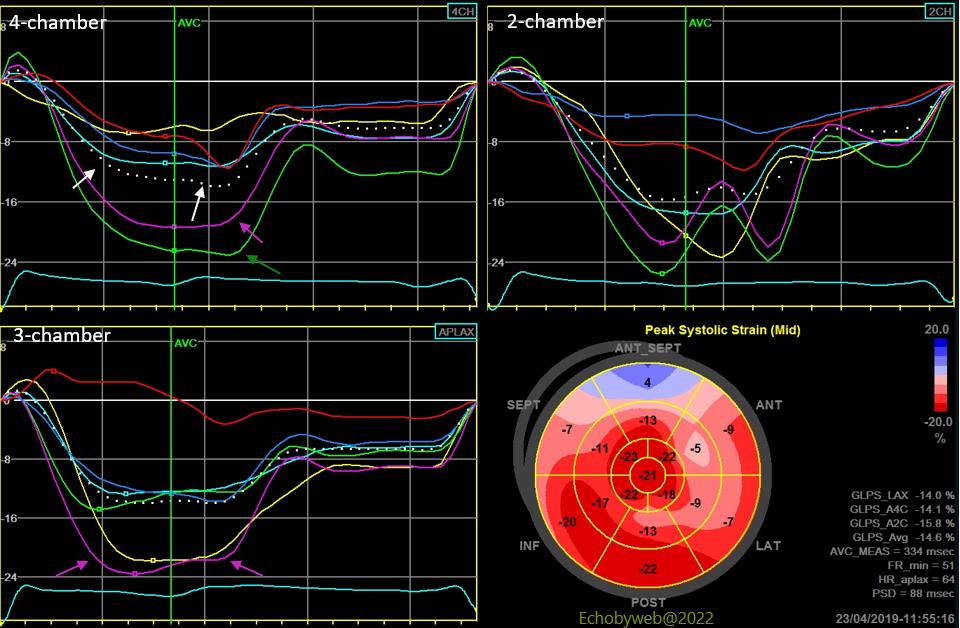
Operator 1 (Figure 7).
GLS= Average=- 14.6 %;
4-chamber= -14,1%
2-chamber= -15.8%
3-chamber= -14%
PSD= 88 ms
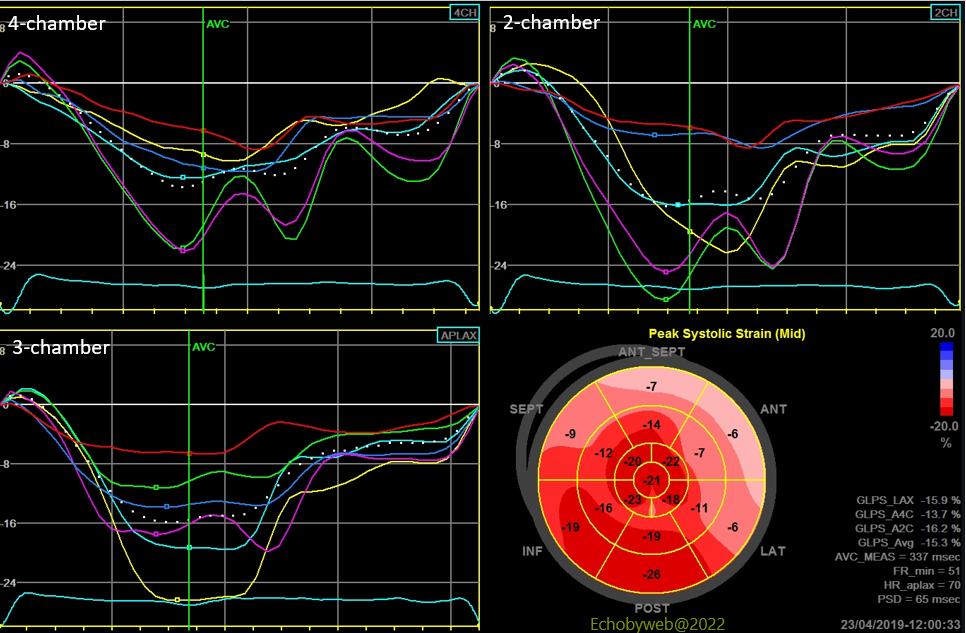
Operator 2 (Figure 8).
GLS= Average=- 15.3 %;
4-chamber= -13,7%
2-chamber= -16.2%
3-chamber= -15.9%
PSD= 65 ms
In this patient example, longitudinal strain global and regional values are slightly underestimated by Operator 1 (unaware of LV foreshortening). The major differences can be observed at the segmental level, as expected prevalently in the 4-chamber view, and concern mainly the apical segments (green and purple arrows).
In the presence of foreshortening, peak apical systolic velocities may be higher, and both the systolic and early diastolic curve shapes are modified (white arrows point to the dotted regional mean curve).
In this patient with 3-vessel coronary artery disease (s/p CABG) and prevalently septal LV hypertrophy, global longitudinal strain (GLS) is mild to moderately reduced and segmental reductions of peak systolic strain can be observed in the hypertrophic septum, and lateral and anterior walls.