[Page 4]
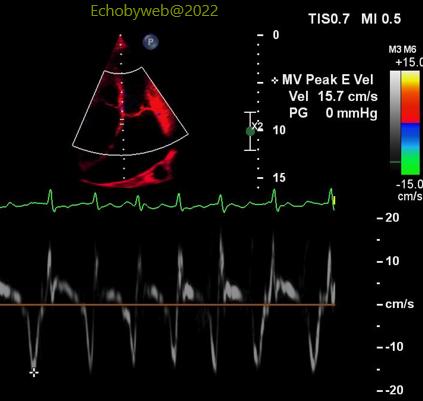
> The mitral valve peak E wave shows a marked variation – apparently during respiration (Figures 12-13). However, the presence of irregular atrial fibrillation is a confounder and makes this pericardial constriction sign potentially unrealiable.
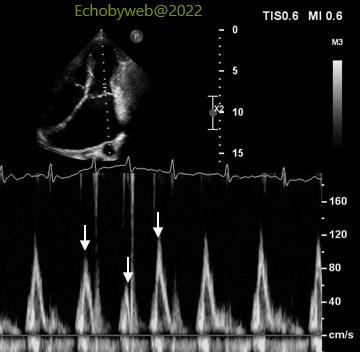
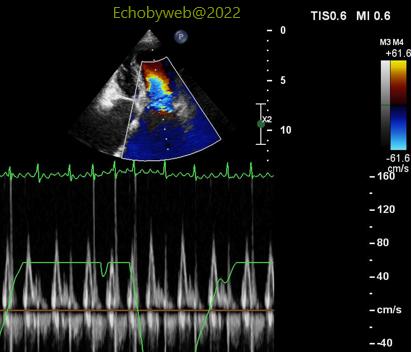
> The pulsed tissue Doppler sampling of the mitral annulus (Figure 14-15) shows equivalent / slightly higher peak myocardial velocities on the medial/septal side (Figure 14), another sign consistent with pericardial constriction.
>二尖瓣E峰呈现显著变化—明显伴随呼吸变化(图12-13)。然而,不规则房颤的出现是一个干扰因子,使得此心包缩窄信号有潜在的不可靠性。 >脉冲组织多普勒二尖瓣瓣环取样(图14-15)显示中部/间隔一侧的心肌最大速度与侧壁相比,数值相等或稍高(图14),这是另一个符合心包缩窄的信号。