[Page 5]
C. Parasternal Short Axis, Base of the Heart – 胸骨旁短轴,心脏底部
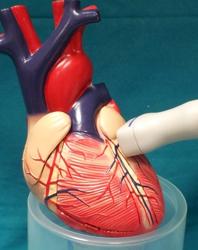
2D video clip. Short axis of the base, centered on the aortic valve.
Position markers, visualization of:
1. The 3 Valsalva sinuses;
2. Symmetrical systolic opening of the 3 aortic cusps.
Define the anatomy and dynamics of the aortic cusps (in this video clip there is a small fibrotic nodule at the commissure between the posterior noncoronary and the left coronary cusps). Evaluate the anatomy of the left atrium and exclude left atrial masses. Exclude anterior pericardial effusion / adhesions.
2D 动态图像. 底部短轴,主动脉瓣放中间
CD video clip. Aortic valve flow.
Locate origin and direction of regurgitant flow, if present. Check integrity of the proximal interventricular septum.
彩色多普勒动态图像. 主动脉瓣血流;找到有效返流口面积
2D video clip. Short axis of the base, centered on the TV. Locate and maximise regurgitant jet location / direction, if present. See Online Calculator here. Exclude aliasing secondary to stenosis.
Exclude interatrial septal defect.
2D动态图像. 底部短轴,三尖瓣放中间
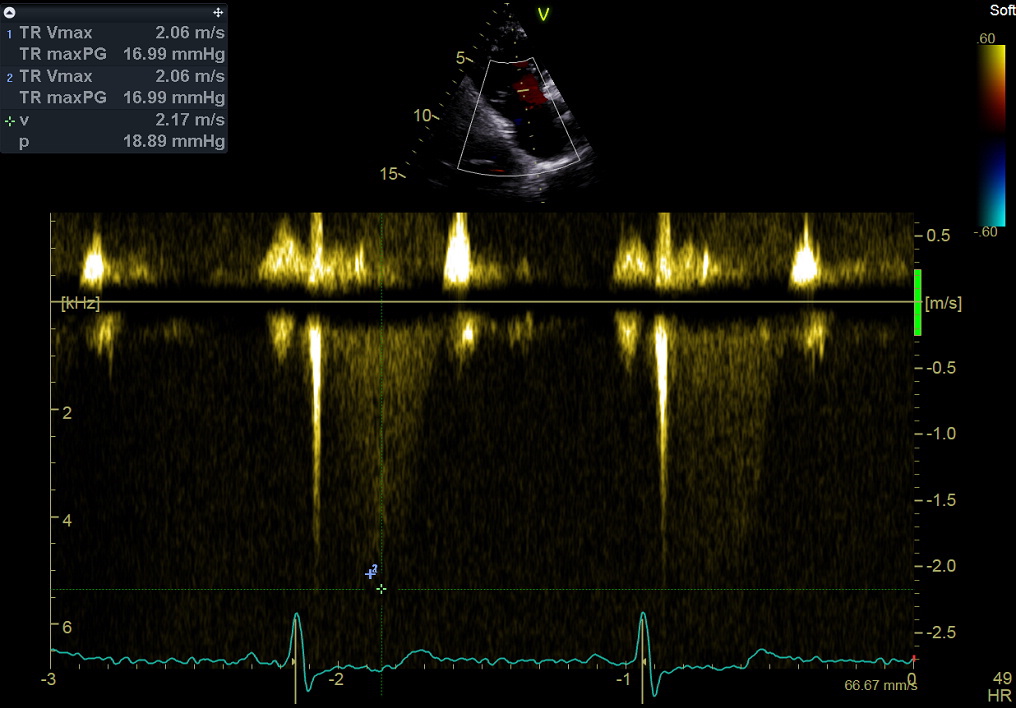
Continuous Wave Doppler still frame. Tricuspid regurgitation: measurement of peak mid-systolic velocity. Purpose: to estimate right ventricular systolic pressure (see online Calculator here), combined with estimation of right atrial pressure (inspiratory collapsibility of the inferior vena cava, see Page 12).
This measurement – together with the right ventricular outflow tract time-velocity integral – is currently used in a validated formula to estimate also pulmonary vascular resistances (see Online Calculator here).
Note that peak tricuspid regurgitant velocity should be evaluated in multiple views.
连续波多普勒图像. 三尖瓣返流,测量:最大流速
2D video clip. Short axis of the base, centered on the Pulmonary valve and pulmonary artery.
Position markers, visualization of:
1. 2 pulmonary valve cusps;
2. Pulmonary artery bifurcation.
2D动态图像. 底部短轴,肺动脉瓣和肺动脉放中间
CD video clip. Pulmonary valve flow: locate and maximise regurgitant jet location / direction, if any.
Exclude aliasing secondary to sub-valvular or valvular stenosis. Search for evidence of Botallo defect (diastolic aliasing backward flow in the pulmonary artery).
彩色多普勒动态图像. 肺动脉瓣血流(返流);看是否有动脉导管未闭
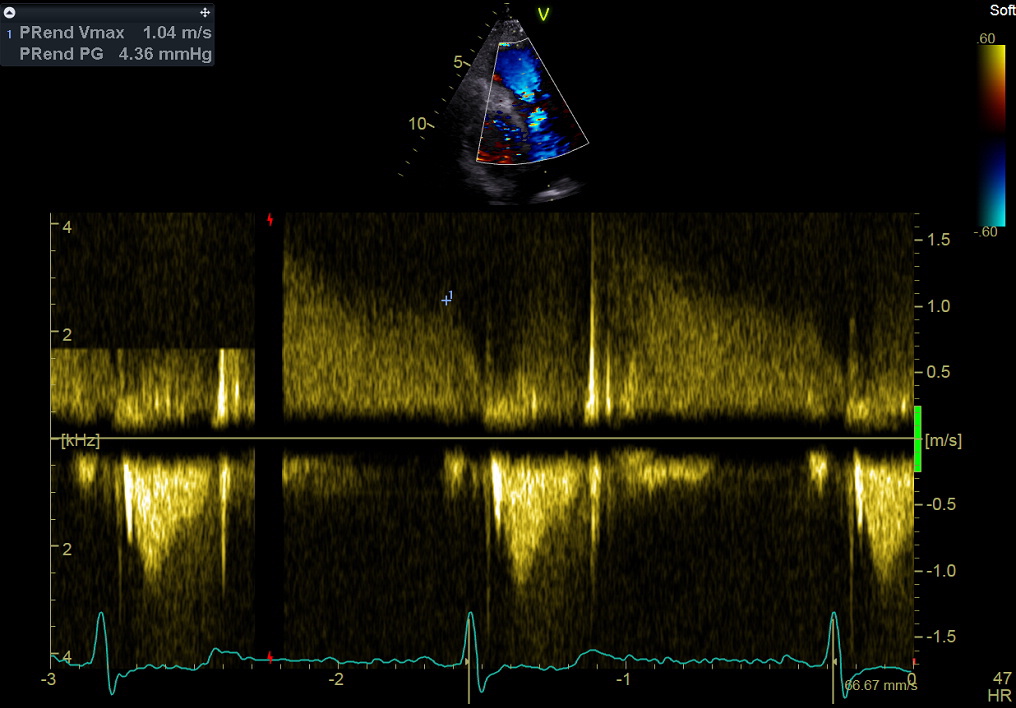
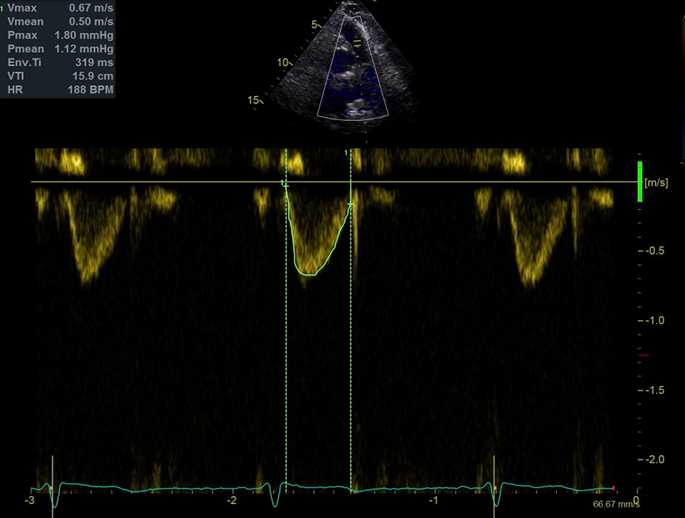
Continuous Wave Doppler still frame. PV regurgitation, measurement of peak end-diastolic velocity. This measurement is used to estimate Pulmonary Diastolic Pressure ( see Online Calculator here), and mean left atrial pressure (= left ventricular filling pressure).
连续波多普勒图像. 肺动脉瓣返流,测量:舒张末期最大流速
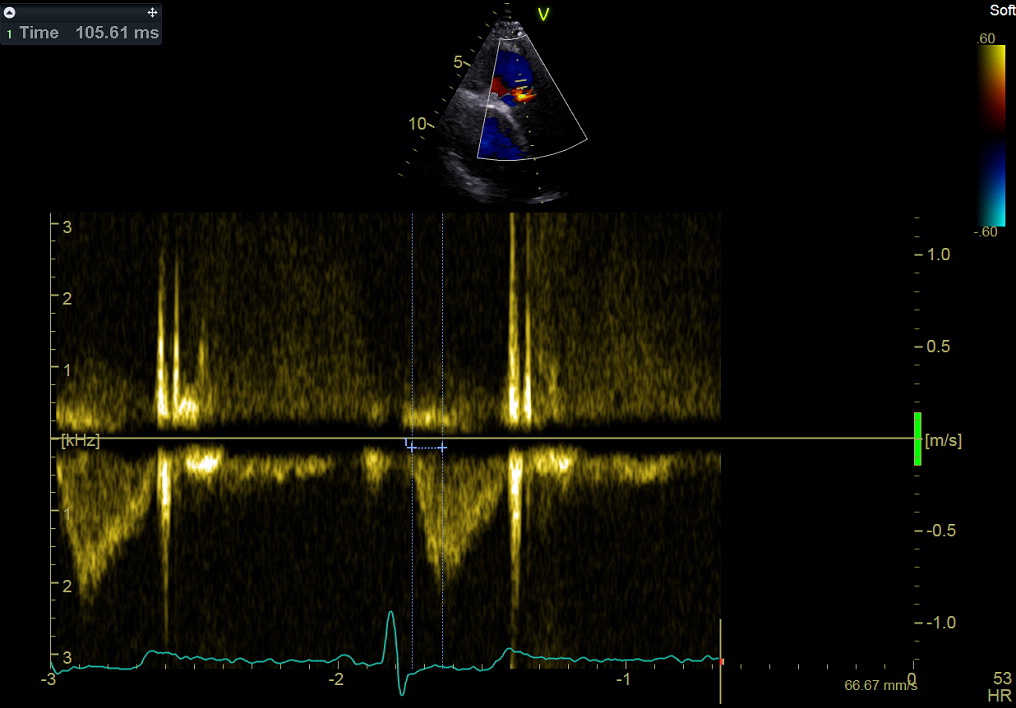
Pulsed Doppler. Right ventricular outflow, measurement of time to peak flow velocity.
This measurement is used to categorize (roughly) pulmonary systolic pressure.
脉冲多普勒. 右室流出道血流,测量:达到最大血流的时间
Pulsed Doppler. Right ventricular outflow tract. Measurement of the time-velocity integral.
This measurement – together with peak tricuspid regurgitant velocity – is currently used in a validated formula to estimate pulmonary vascular resistances (see Online Calculator here).
脉冲多普勒. 右室流出道,测量:速度时间积分