[Page 9]
Respiratory variations of LV outflow and inflow velocity profiles.
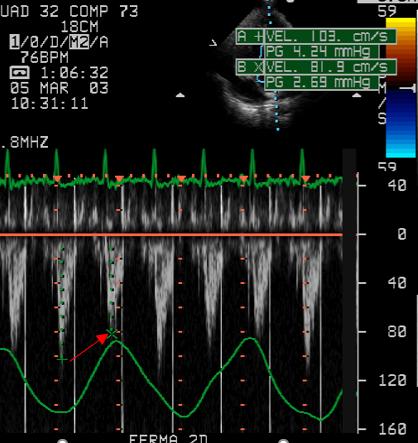
Inspiratory reduction of LV outflow peak velocity (red arrow).
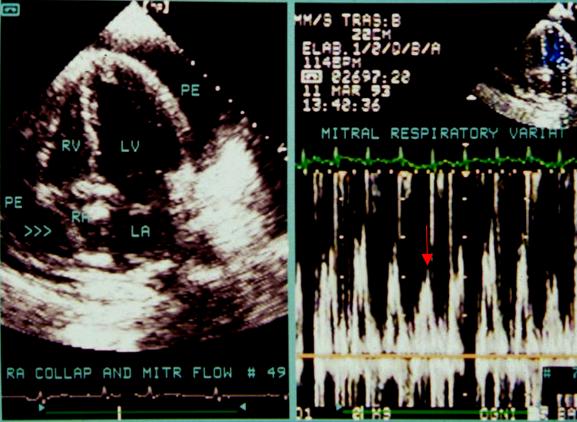
Inspiratory reduction of LV inflow (mitral) peak velocities (red arrow).
Diagnosis of pericardial tamponade.
Echocardiography. The echocardiographic signs reflect the progressive increase in intra-pericardial pressure, which exceeds initially systolic and then diastolic right atrial pressures, and finally diastolic right ventricular pressure.
Clinical signs. The clinical signs reflect the changes in systemic arterial pressure and cardiac output. The pulsus paradoxus may be absent in some clinical situations.