[Page 10]
Atypical presentations in the cardiac surgery post-operative period.
- Variations of blood volume may influence sensitivity and specificity of the right atrial collapse (occurs earlier in hypovolemia)
- Absence of right atrial / right ventricular collapse (false negative signs) in the presence of an acute or chronic increase in the pressures of the right heart chambers
- Absence of pulsus paradoxus secondary to LV systolic dysfunction, loculated (regional) effusion, positive end-expiratory pressure ventilation (PEEP)
- In the presence of of left heart compression in loculated (regional) tamponade, the tamponade occurs in the presence of normal right atrial and venous systemic pressures.
- 803 consecutive patients
- Occurrence of pericardial effusion= 64%
Mild= 68% / Moderate= 30% / Severe= 2% - Type of effusion
Loculated= 58% / Diffuse= 42% - Tamponade= 1.9%
(12 valvular prosthesis and 3 CABG)
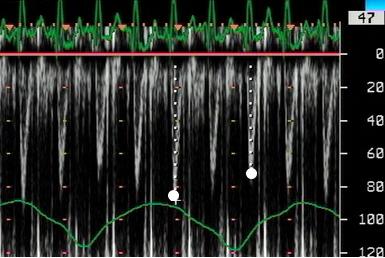
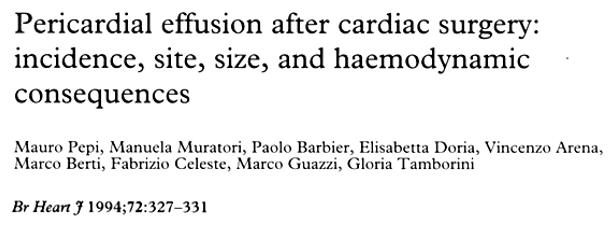
Figures 58-62. Severe loculated effusion lateral to the LV (Figures 58-60) with signs of local tamponade (Figure 61): diastolic collapse of the LV wall (Figure 62, white arrow). Figure 61 shows 20% inspiratory reduction of LV stroke volume (LVOT peak flow velocity, white dots). Asterisk: pericardial effusion.
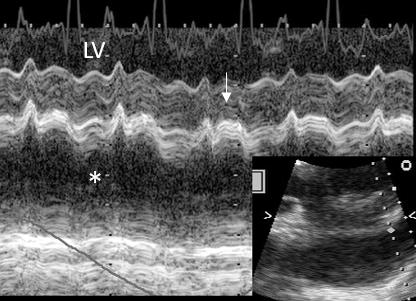
Figure 63. Post-open heart surgery TE exam (lower esophagus, 4-chamber) showing LA loculated effusion (1, white arrow), with progression towards hematoma formation (2 and 3, white arrow), with compression of the LA wall and almost complete obliteration of the LA cavity and cardiac tamponade. In 4, after surgical drainage.
Figures 64-68. Loculated left atrial pericardial effusion with progression towards hematoma, complete LA compression, and tamponade. Fig 64: LA hematoma compressing the LA lateral wall. Fig 65: obstructed (aliasing) flow in the LA. Fig 66: Scan from the descending thoracic aorta (on the right) and the LA (visualized unimpeded flow in left pulmonary veins). Fig 67: the large LA hematoma. Fig 68: from left to right: LV, pericardial effusion, pleural effusion.
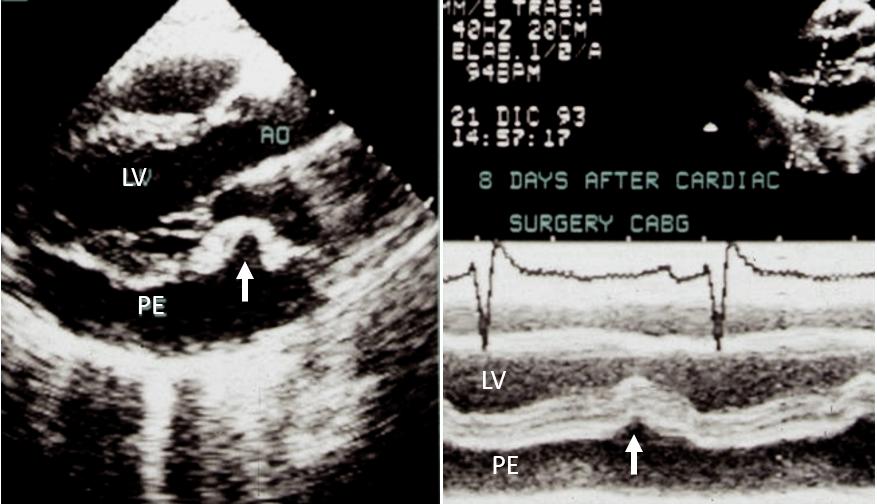
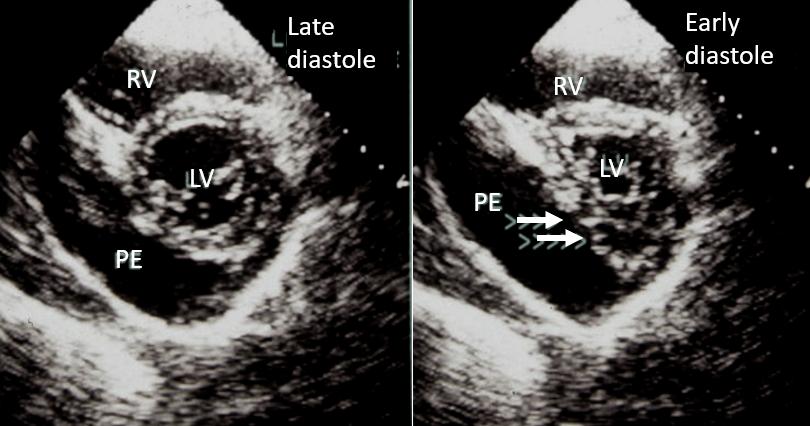
Figure 69-70. Severe pericardial effusion (8 days after CABG) inferior and posterior to the LV. Collapse of the LA wall (Fig. 69, left panel, white arrow). Diastolic collapse of the LV posterior wall (Fig. 69, right panel, M-mode, white arrow). Early diastolic collapse of the LV inferior wall (Fig.70, right panel, double white arrow).